Operations 12 - 23
8. Refer to the following Wireless Clients fields to configure the display of debug messages from wireless clients.
9. Refer to the following Settings fields.
10. Use the Start button to start capture of debug messages. Use Stop to stop the capture. Use the Type to filter text area to
filter debug messages.
11. Use Close to close this screen.
12.1.5.6 Packet Capture
Troubleshooting the Device
Use the Packet Capture screen to capture packets to troubleshoot network issues. To view the Packet Capture screen:
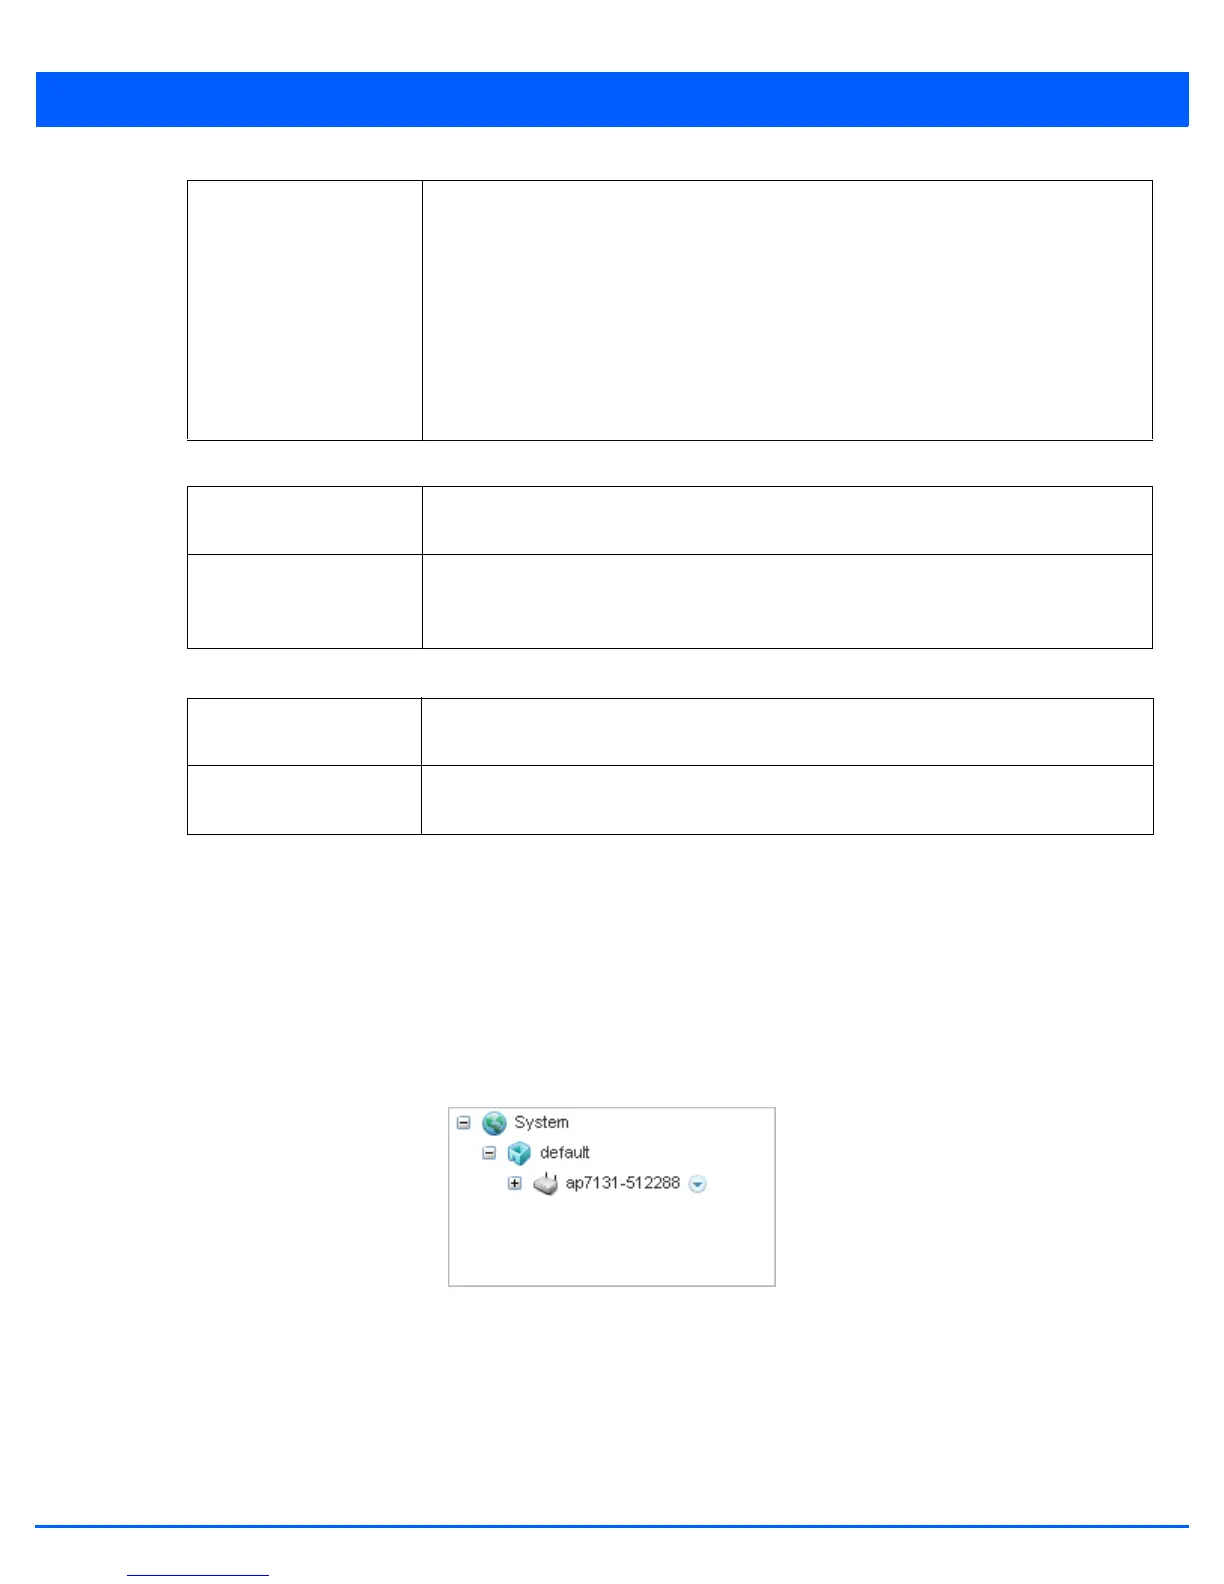
1. Select the target device from the left-hand side of the UI.
Figure 12-36 Device Browser
2. Select the down arrow next to the device to view a set of operations that can be performed on the selected device.
Selected Debug
Messages
Select this to display only selected debug messages. The list of debug messages that can
be selected are:
• 802.11 Management – Displays all 802.11 management debug messages.
• EAP – Displays all debug messages related to EAP.
• Flow Migration – Displays all debug messages related to flow migration.
• RADIUS – Displays all debug messages related to RADIUS server.
• System Internal – Displays all debug messages related to system internals.
• WPA/WPA2 – Displays all debug messages related to WPA/WPA2.
All Wireless Clients Select this to display all debug messages generated by all the wireless clients associated
with this device.
Selected Wireless
Clients (up to 3)
Select this to display debug messages from up to 3 wireless clients whose MAC addresses
are specified. The MAC addresses must be entered in the fields Client MAC 1, Client MAC
2 and Client MAC 3.
Duration of Message
Capture
Use the spinner to set the maximum duration of message capture in Hours, Minutes and
Seconds. The default is 10 minutes.
Maximum Events Per
Wireless Client
Use the spinner control to set the maximum number of events that is received from a
wireless client. The default value is 100 messages.
 Loading...