Data Log Viewer Component (v2.0 and v1.8) SECTION 11 Data Logging
173
11-4-2-2 New Features:
The basic functionality remains largely the same however the following
features are new to version 2.0 of the Data Log Viewer.
• Modern User Interface - The user interface has a modern look and feel.
• Better Zoom and Pan Control - Features include double click to zoom in
on a specific point on the graph, ability to zoom a specific area of the graph
and the ability to grab and move the graph around (i.e. left, right, up or
down).
• Data Table View - A data table view allows instantaneous values to be
displayed based on a 'cursor' position on the graph.
• Improved Cursors - Horizontal and Vertical cursors can be used to analyse
the data. Where a cursor intersects the data the value will be displayed in
the Data Table view.
• Y Offset - Ability to quickly and easily scale data to make it easier to read.
• X Offset - Ability to overlay data (i.e. overlay one week on another week).
• Snapshot as JPEG - A screen shot of the Data log Viewer display,
including all visible trend data, can be saved as an image file (.JPG).
• Support for Comma Separated Files - Ability to open and view data from
comma separated files (.CSV).
• Support for Database Files - Ability to open and view data from database
files (.MDB).
• Multiple File Support - Ability to view large amounts of data spanned
across multiple files (e.g. 1 year) on the same graph.
For more details refer to the Data Log Viewer online help.
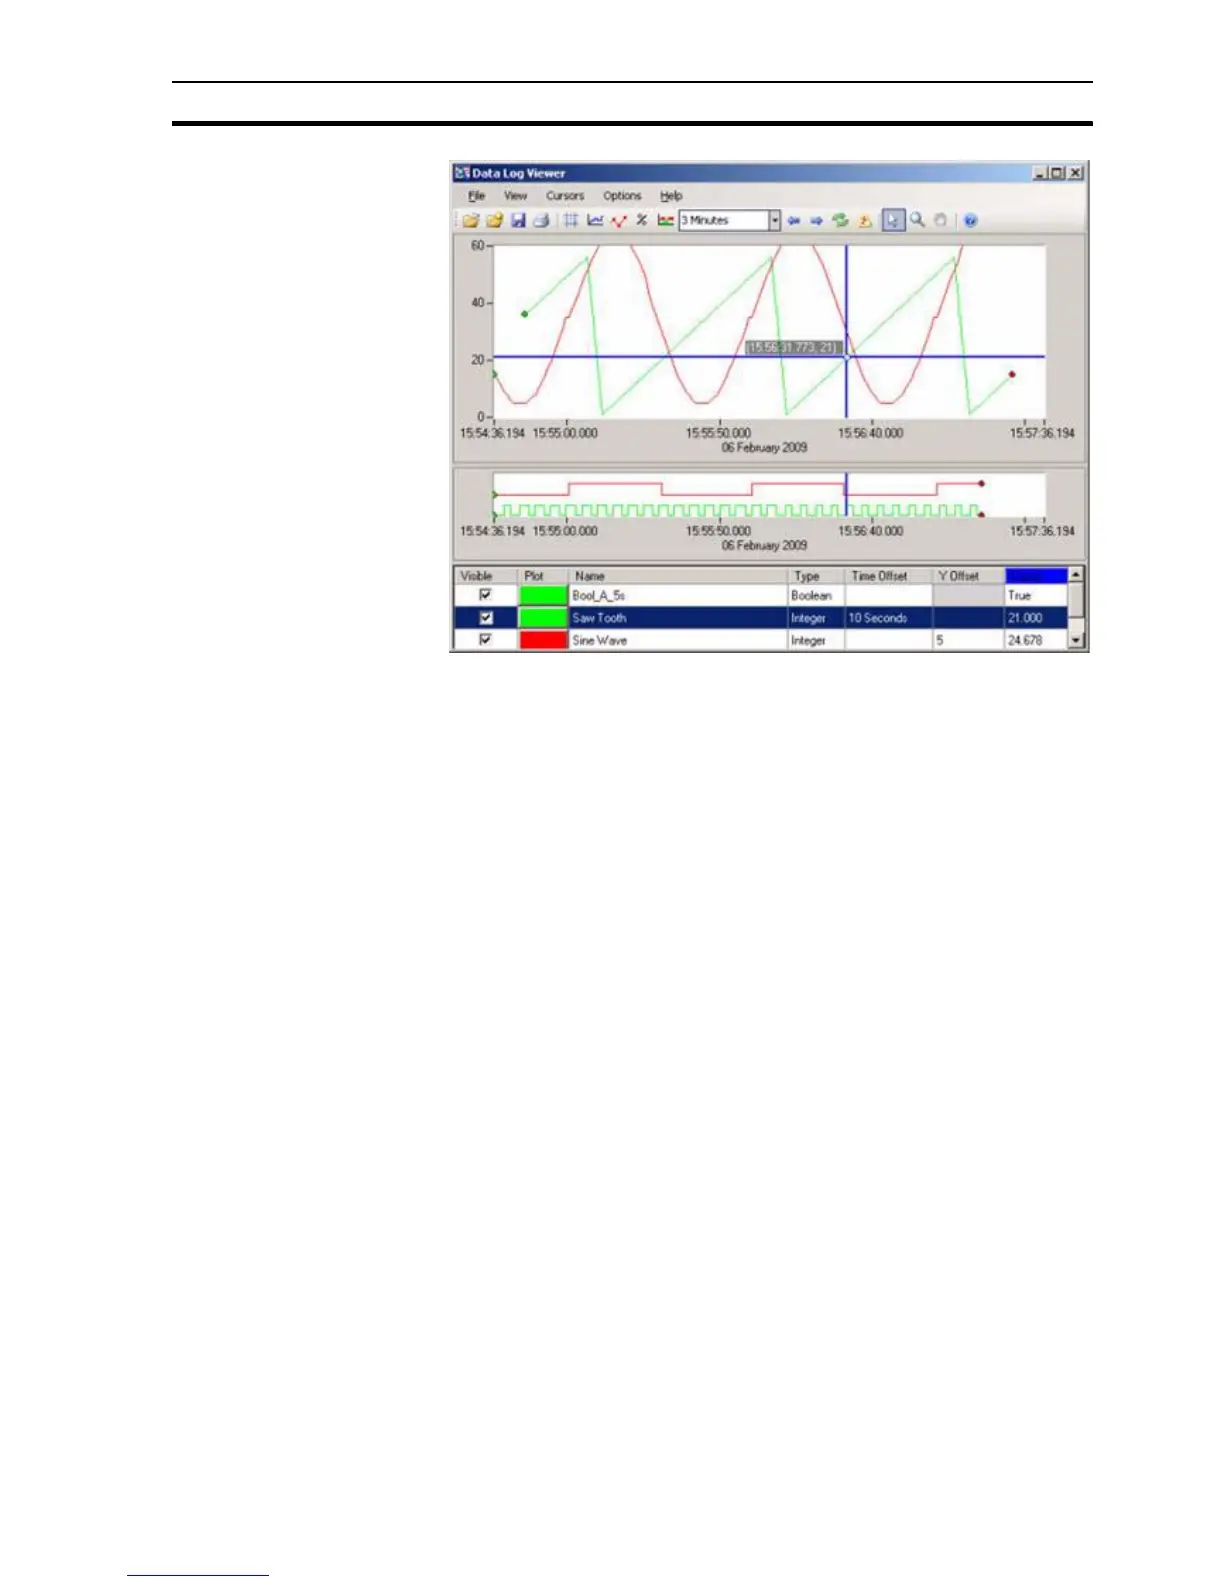
11-4-3 Data Log Viewer 1.8
Data Log Viewer 1.8 looks like this: