Creating and Editing Control Objects SECTION 4 Objects
63
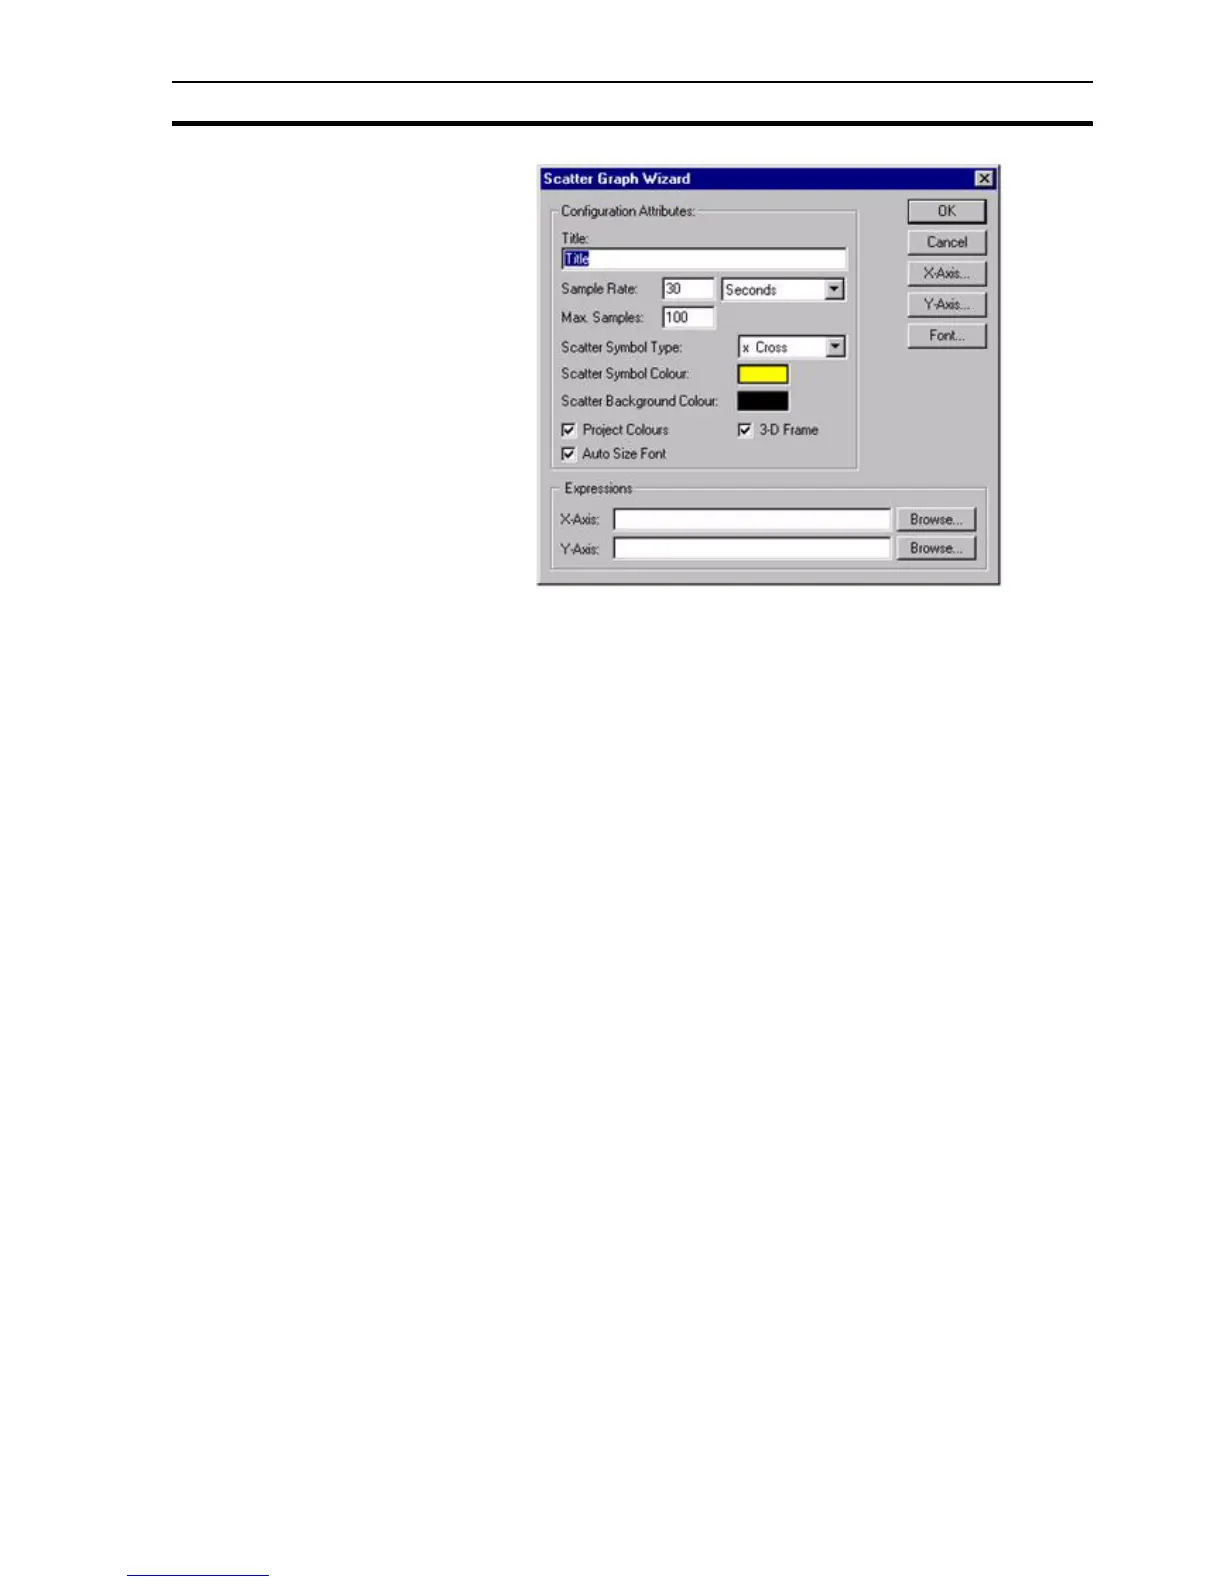
The Wizard allows entry in the Configuration Attributes: and Expressions
fields.
1, 2, 3… 1. Enter the frequency of data sampling in the Sample Rate: field; in this
example the sample rate is every thirty seconds.
2. Enter the maximum number of samples to be displayed on the scatter
graph in the Max Samples: field.
3. Select the type of symbol to represent the data.
4. Select the colour of the symbol representing the data.
5. Select the colour of the scatter graph background.
6. Toggle the Project Colours and 3-D Frame settings as desired. If set, the
Project Colours field allows the colour of the axis to be changed using the
Palette. The 3-D Frame option enables the graph to appear with a 3-D
frame.
7. Either enter an arithmetic expression for the X and Y axis or select one
through the Browse button. An expression point can also be associated
with the Scatter Graph Wizard by dragging a point directly from the Point
Editor. Refer to chapter 3, Points regarding adding a new point and
dragging from the Point Editor.
8. Change the fonts used for the Scatter Graph via the Font button. The font
size used by the graph can be automatically calculated for the user by
selecting the Auto Size Font field.
9. Exit the Scatter Graph Wizard by clicking the OK button to accept the new
scatter graph attributes or click the Cancel button to leave the scatter
graph unchanged.
To configure the X axis, click the X-Axis button. To configure the Y-axis , click
the Y-Axis button. The Axis Scaling dialog box opens: