Introduction to Remote ViCom Sample App
R&S
®
TSMA6
180User Manual 4900.8057.02 ─ 11
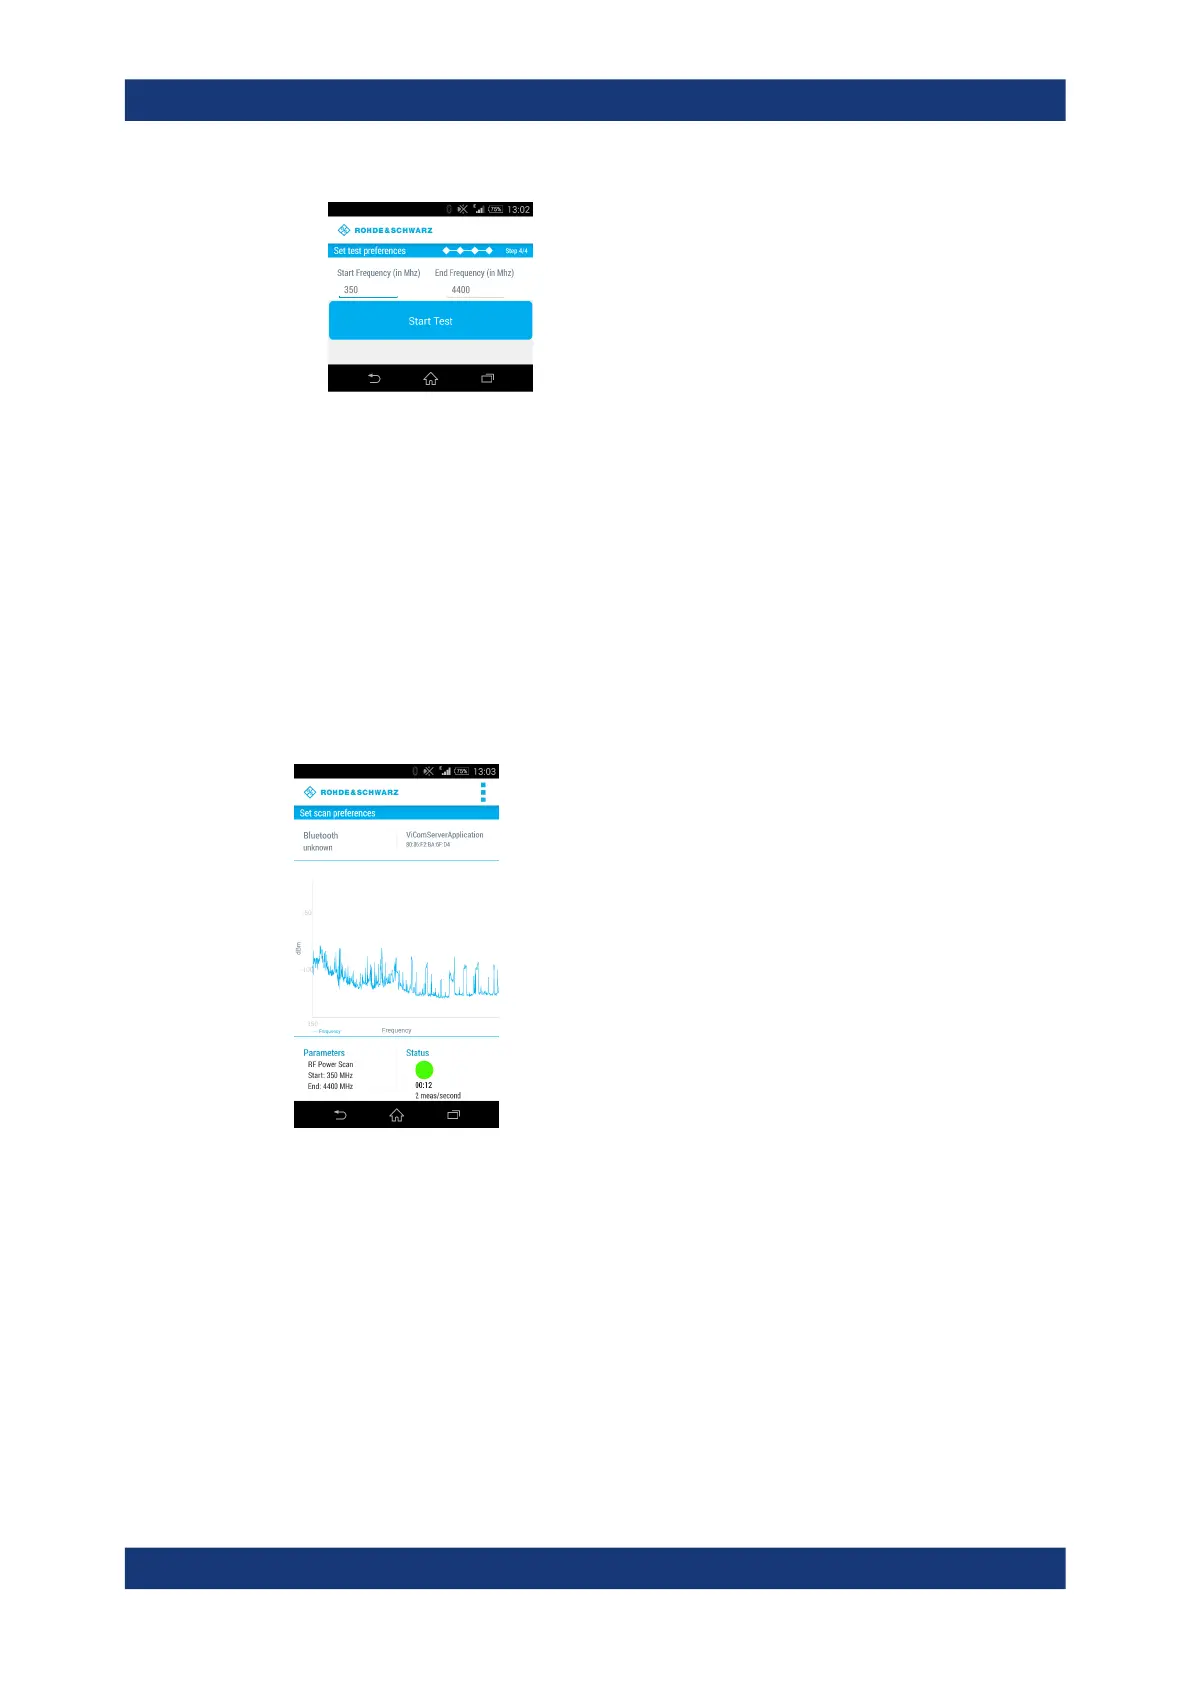
Figure B-13: RF Power Scan References
2. Click "Start Test" to start the scan.
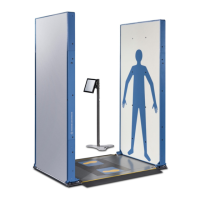
B.3.6.2 RF power scan results
The result of the RF power scan is a spectrum of the frequency range set before with
the following axes:
●
x-axis
The x-axis displays the frequency
●
y-axis
The y-axis displays the power level for each frequency (dBm)
Figure B-14: RF Power Scan Results
Below the graph the measurement preferences and the status are displayed.
Parameters
●
Start
Displays the start frequency
●
End
Displays the end frequency
Usage