CD600 Plus - User's Manual
4.38
Function 14 - Linearization (LIN)
Operation
This block linearizes the input signal in accordance with a curve established in the Function 31 -
Linearization Curve (Blocks 109 to 116)
, configured in loop G. This curve may be used with 13,
26, 52, 78 or 104 pairs of points X, Y, interconnected by straight line segments. The curves that may
be performed are shown on Table 4.31.1.
A
75/76
OUTPUT
INPUT
CURVE n
Input (X) and output (Y) variables may take the following values:
Input - axis X → -102.00 to +102.00%
Output - axis Y
→ -300.00 to +300.00%
It is not necessary to adjust all points available (13, 26, 52, 78 or 104). Should a curve be performed
by only 4 points, it is possible to adjust only these four points.
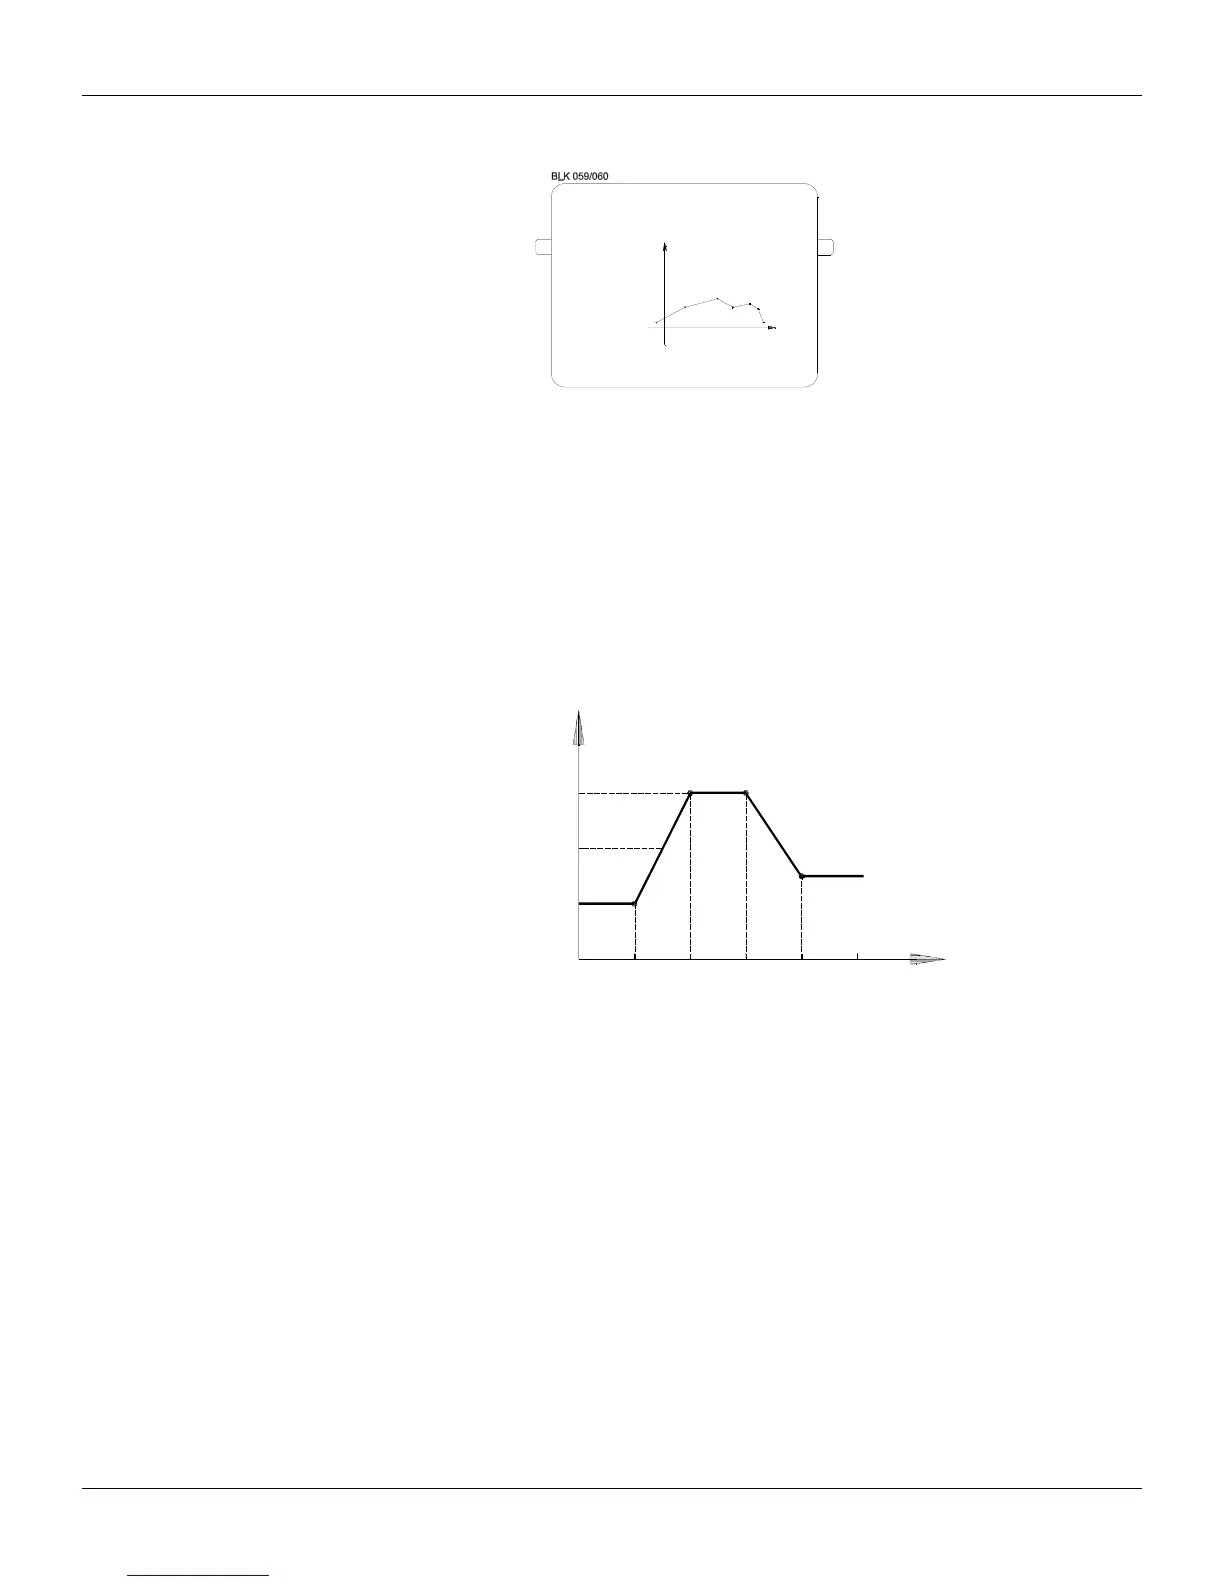
EXAMPLE:
Y%
150
100
50
20
40
60
80
100
X%
Fig 4.14.1 - Typical Curve
Considering parameter CLIN=1, the curve may be adjusted in block 109 of loop G with the following
pairs of points:
X1 = 20 Y1 = 50
X2 = 40 Y2 = 150
X3 = 60 Y3 = 150
X4 = 80 Y4 = 75
X1 is the minimum value considered. Even when the input is smaller than the value of X1, in the
example 20%, the output will be the corresponding Y1, in the example 50%.
The same principle does not apply for the maximum value! In the example, X4 = 80% is the last
point. If the input is bigger than 80%, the program will search for this value at the remaining points
(X
5
to X
13
). If the value is not found, the program would assume the next higher X, for example X
12
=
55. The output would be the value of Y
12
.
In order to avoid this problem, it is always convenient to configure the last point of the curve with Xi
= 102%, and Yi with the applied value.
In the example:
X5 = 102 Y5 = 75