SVAN 948 USER MANUAL .
3 - 22
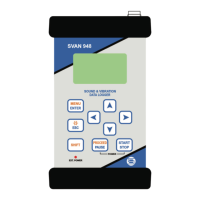
- “Vertical bars” icon corresponds to the current input signal level (it is related to the maximum
measured value over the last second). The sign Ç
ÇÇ
Ç means that the level of the signal was from 0.1 dB to
10 dB higher then the current measurement range. For example, for the SLM mode, in which only one
range is available (130 dB), the result of the measurement is in this case from 130.1 dB to 140 dB. The
indicator of the overload (the ”Bell” icon) appears when the signal overpasses more than 7.5 dB the
measurement range (cf. Fig. below).
a)
b) c)
d) e)
g) h) i)
The view of the display in the SLM mode without the “Vertical bars” icon (a); with one “Vertical bar” (b),
(c); with two “Vertical bars” (d), (e); with three “Vertical bars” (f), (g); with three “Vertical bars” and the
Ç
ÇÇ
Çsign (h); with the indicator of the overload (i)
The number of the ”Vertical bars” on the display depends on the level of the measured signal, the
selected mode (SLM, VLM, 1/1 OCTAVE, 1/3 OCTAVE or FFT analysis, etc) and the calibration factor.
The limits of the signal causing the different icon’s indication for the calibration factor equal to 0 dB are
presented in the Table 3.1 in the case of sound measurements and in Table 3.2 – in the case of vibration
measurements. Non-zero value of this factor causes the shift of the limits given in the tables.
Notice: The “Bell” icon is used as an indicator of an overload.
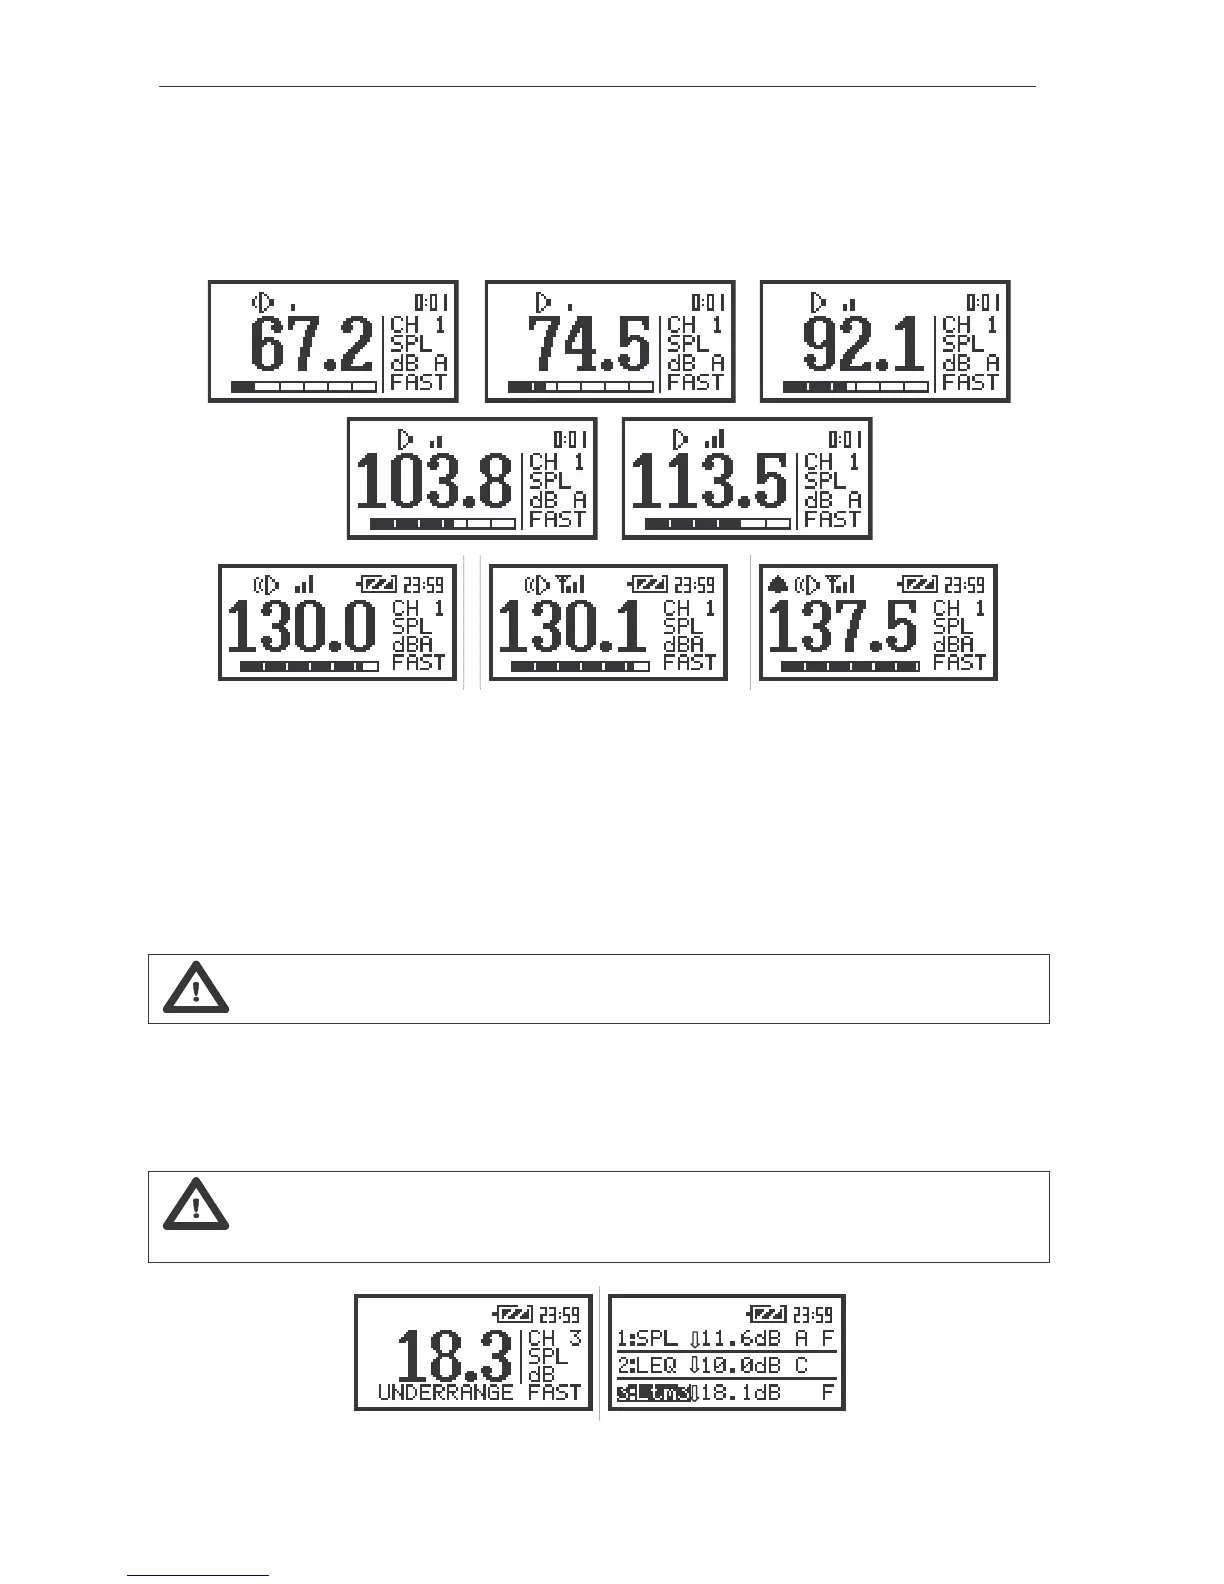
In the case when the level of the measured signal is too low in the relation to the measuring
range (when the level of the input signal is under the linearity of the range declared in App. C, so-called
UNDERRANGE) in one profile mode the message is displayed in the field of the analogue indicator of the
measurement result. The arrow directed down is used for this reason in 3 PROFILES mode.
Notice: The UNDERRANGE is indicated only in the case of sound measurements. It does
not occur in the case of vibration measurements.
The view of the displays when the level of the signal is too low during the measurements of the sound