SVAN 948 USER MANUAL
3 - 23
Table 3.1. The limits of the signal causing the different icon’s indication in the case of sound measurements
SLM 1/1 OCTAVE, 1/3 OCTAVE or FFT ANALYSIS
INDICATOR
130 dB range 105 dB range 130 dB range
“Bell”
≥ 137.5 dB ≥ 114.5 dB ≥ 137.5 dB
Ç+ 3 “Bars”
≥ 130.1 dB ≥ 105.1 dB ≥ 130.1 dB
3 “Bars”
100.1 dB – 130.0 dB 80.1 dB – 105.0 dB 105.1 dB – 130.0 dB
2 “Bars”
70.1 dB – 100.0 dB 55.1 dB – 80.0 dB 80.1 dB – 105.0 dB
1 “Bar”
40.1 dB – 70.0 dB 30.1 dB – 55.0 dB 55.1 dB – 80.0 dB
≤ 40.0 dB ≤ 30.0 dB ≤ 55.0 dB
UNDERRANGE
< 24.0 dB A < 24.0 dB A < 44.0 dB A
UNDERRANGE
< 24.0 dB C < 24.0 dB C < 42.0 dB C
UNDERRANGE
< 30.0 dB < 30.0 dB < 48.0 dB
Table 3.2. The limits of the signal causing the different icon’s indication in the case of vibration measurements
(values expressed in decibels are calculated with the assumption that the reference level is equal to 1 µm/s
2
)
VLM, 1/1 OCTAVE, 1/3 OCTAVE or FFT ANALYSIS
INDICATOR
17.8 m/s
2
range
145 dB range
316 m/s
2
range
170 dB range
“Bell”
≥ 53.1 m/s
2
≥ 154.5 dB
≥ 750 m/s
2
≥ 177.5 dB
Ç+ 3 “Bars”
≥ 18.0 m/s
2
≥ 145.1 dB
≥ 320 m/s
2
≥ 170.1 dB
3 “Bars”
1.01 m/s
2
– 17.8 m/s
2
120.1 dB – 145.0 dB
18.0 m/s
2
– 316 m/s
2
145.1 dB – 170.0 dB
12 “Bars”
56.9 mm/s
2
– 1.00 m/s
2
95.1 dB – 120.0 dB
1.01 m/s
2
– 17.8 m/s
2
120.1 dB – 145.0 dB
1 “Bar”
3.20 mm/s
2
– 56.2 mms/
2
70.1 dB – 95.0 dB
56.9 mm/s
2
– 1.00 m/s
2
95.1 dB – 120.0 dB
≤ 3.16 mm/s
2
≤ 70.0 dB
≤ 56.2 mm/s
2
≤ 95.0 dB
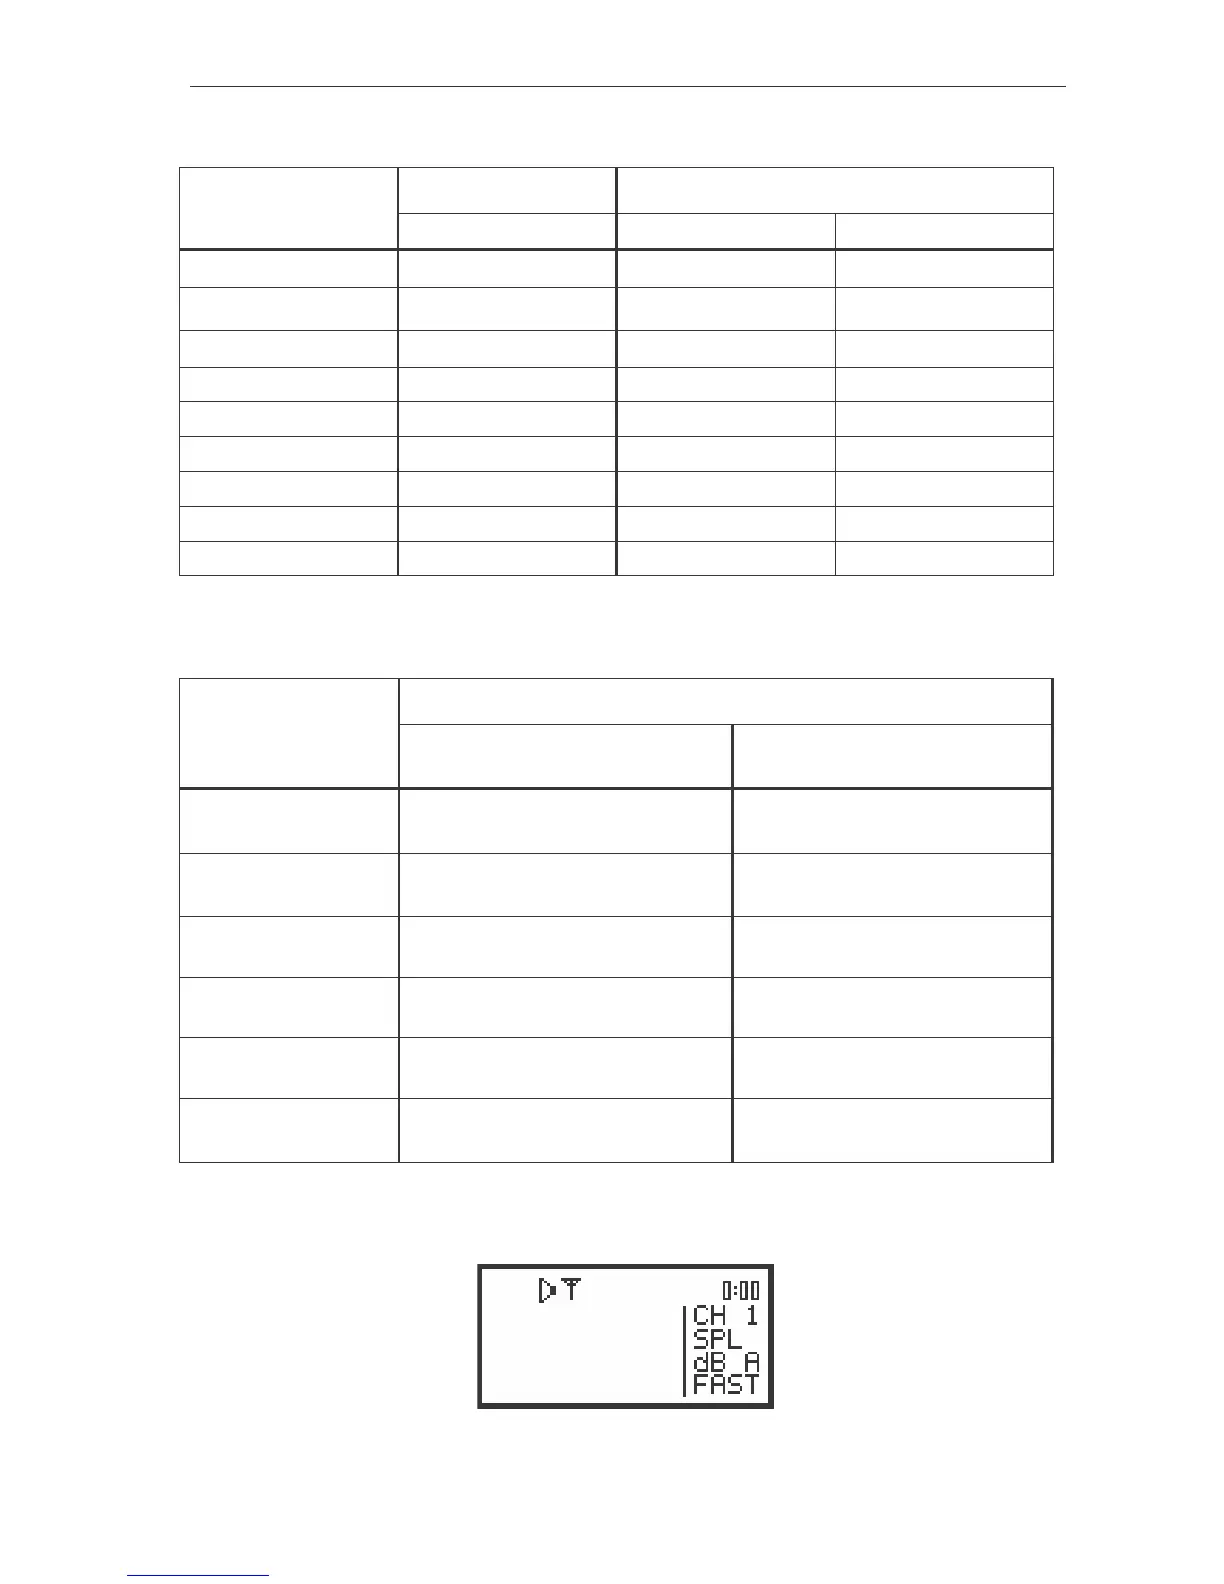
- “Tree” icon is displayed in a flashing mode together with the “Loudspeaker” when the measurement is
started, the trigger is switched on and the level of the signal is too low to start the registration.
The view of the display with the “Tree” and “Loudspeaker” icon