Figure 91: Equilibrium test
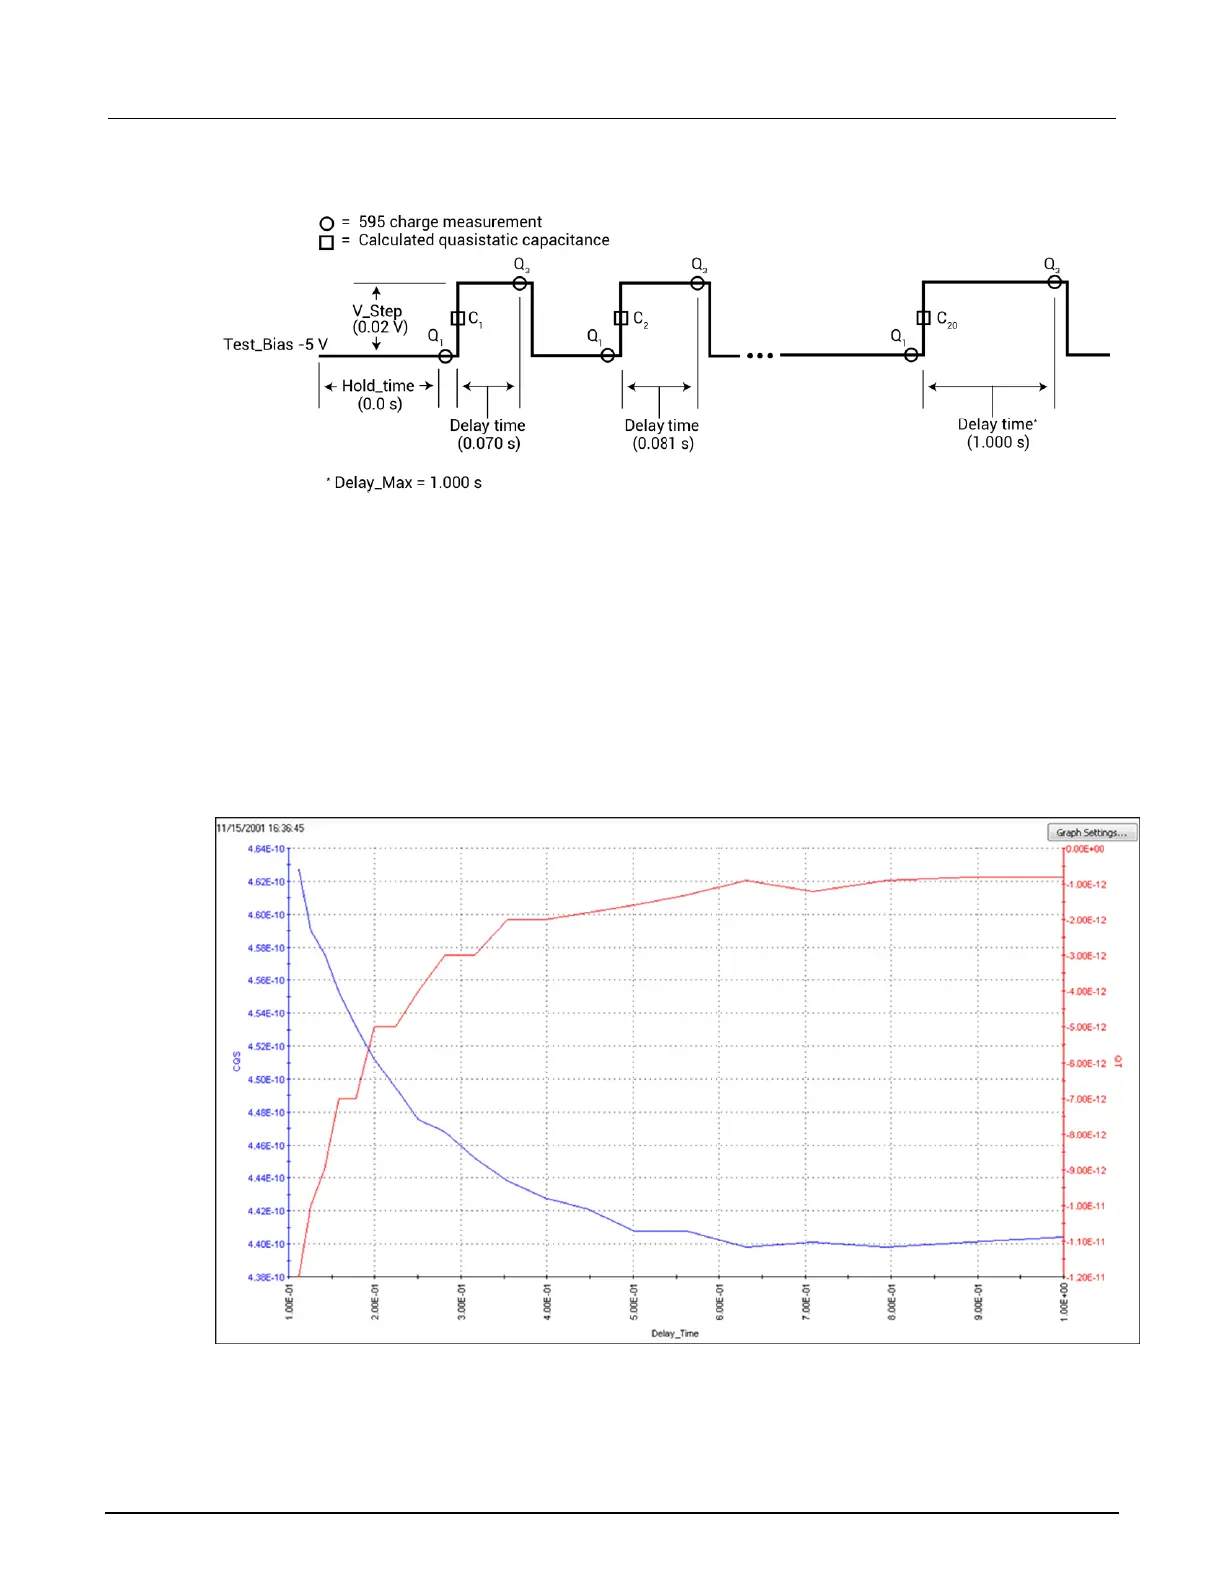
The generated graph for this test plots:
• Quasistatic capacitance (CQS) vs. delay time
• Leakage current (Q / t) vs. delay time
A typical graph for the equilibrium test is shown here. The optimal delay time occurs when both
curves flatten out to a slope of zero. For maximum accuracy, choose the second point on the curves
after they have flattened out.
Figure 92: Equilibrium test graph
 Loading...