CELL-DYN 3000 System Operator’s Manual Master Table of Contents - 13
9140240E — May 1995
List of Figures
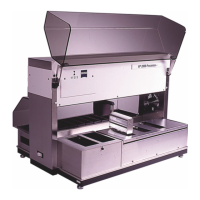
Figure 1.1: CELL-DYN 3000SL . . . . . . . . . . . . . . . . . . . . . . . . . 1-1
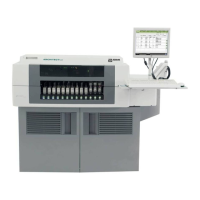
Figure 1.2: CELL-DYN 3000CS . . . . . . . . . . . . . . . . . . . . . . . . . 1-2
Figure 1.3: CELL-DYN 3000 System Components . . . . . . . . . . . 1-5
Figure 1.4: CELL-DYN 3000 Analyzer Front View . . . . . . . . . . 1-6
Figure 1.5: Analyzer Flow Panel Components . . . . . . . . . . . . . . 1-10
Figure 1.6: Analyzer Left Side Panel Components . . . . . . . . . . 1-13
Figure 1.7: Analyzer Rear Panel Components . . . . . . . . . . . . . . 1-15
Figure 1.8: Data Station Front Panel Components and
Standard Computer Keyboard . . . . . . . . . . . . . . . . . 1-17
Figure 1.9: Data Station Right Side Panel Components . . . . . . . 1-19
Figure 1.10: Data Station Rear Panel Components . . . . . . . . . . . . 1-20
Figure 2.1: Data Station Rear Panel . . . . . . . . . . . . . . . . . . . . . . . 2-6
Figure 2.2: Analyzer with Sample Loader . . . . . . . . . . . . . . . . . . 2-8
Figure 2.3: Sample Loader Tubing Connections . . . . . . . . . . . . . 2-9
Figure 2.4: Tube Rack Showing Label Placement Location . . . . 2-11
Figure 3.1: WBC Flow Cell . . . . . . . . . . . . . . . . . . . . . . . . . . . . . 3-7
Figure 3.2: WBC Light Scatter . . . . . . . . . . . . . . . . . . . . . . . . . . . 3-8
Figure 3.3: Optical Bench . . . . . . . . . . . . . . . . . . . . . . . . . . . . . . . 3-9
Figure 3.4: Mononuclear-Polymorphonuclear Scatter . . . . . . . . 3-11
Figure 3.5: Neutrophil-Eosinophil Scatter . . . . . . . . . . . . . . . . . 3-12
Figure 3.6: Mononuclear Scatter . . . . . . . . . . . . . . . . . . . . . . . . . 3-13
Figure 3.7: WBC Histograms . . . . . . . . . . . . . . . . . . . . . . . . . . . 3-14
Figure 3.8: WBC Data and Scatterplots . . . . . . . . . . . . . . . . . . . 3-15
Figure 3.9: Volumetric Metering . . . . . . . . . . . . . . . . . . . . . . . . 3-18
Figure 3.10: RBC Data and Histogram . . . . . . . . . . . . . . . . . . . . . 3-20
Figure 3.11: PLT Data and Histogram . . . . . . . . . . . . . . . . . . . . . 3-23
Figure 5.1: Main Menu Screen . . . . . . . . . . . . . . . . . . . . . . . . . . . 5-2
Figure 5.2: Setup Menu Screen . . . . . . . . . . . . . . . . . . . . . . . . . . . 5-5
Figure 5.3: Date/Time Setup Screen . . . . . . . . . . . . . . . . . . . . . . . 5-6
Figure 5.4: Patient Limits Screen . . . . . . . . . . . . . . . . . . . . . . . . . 5-8
Figure 5.5: Diluent Log Screen . . . . . . . . . . . . . . . . . . . . . . . . . . 5-10
Figure 5.6: QC Setup Menu Screen . . . . . . . . . . . . . . . . . . . . . . 5-12