3-14 CELL-DYN 3000 System Operator’s Manual
9140240E — May 1995
Principles of Operation Chapter 3
Other Scatterplots
90°/0°
The scatter information is plotted with the 90° scatter on the Y axis and
the 0
° scatter on the X axis.
90°D/0°
The scatter information is plotted with the 90°D scatter on the Y axis and
the 0
° scatter on the X axis.
90°D/10°
The scatter information is plotted with the 90°D scatter on the Y axis and
the 10
° scatter on the X axis.
All scatterplots may be displayed and printed at operator request.
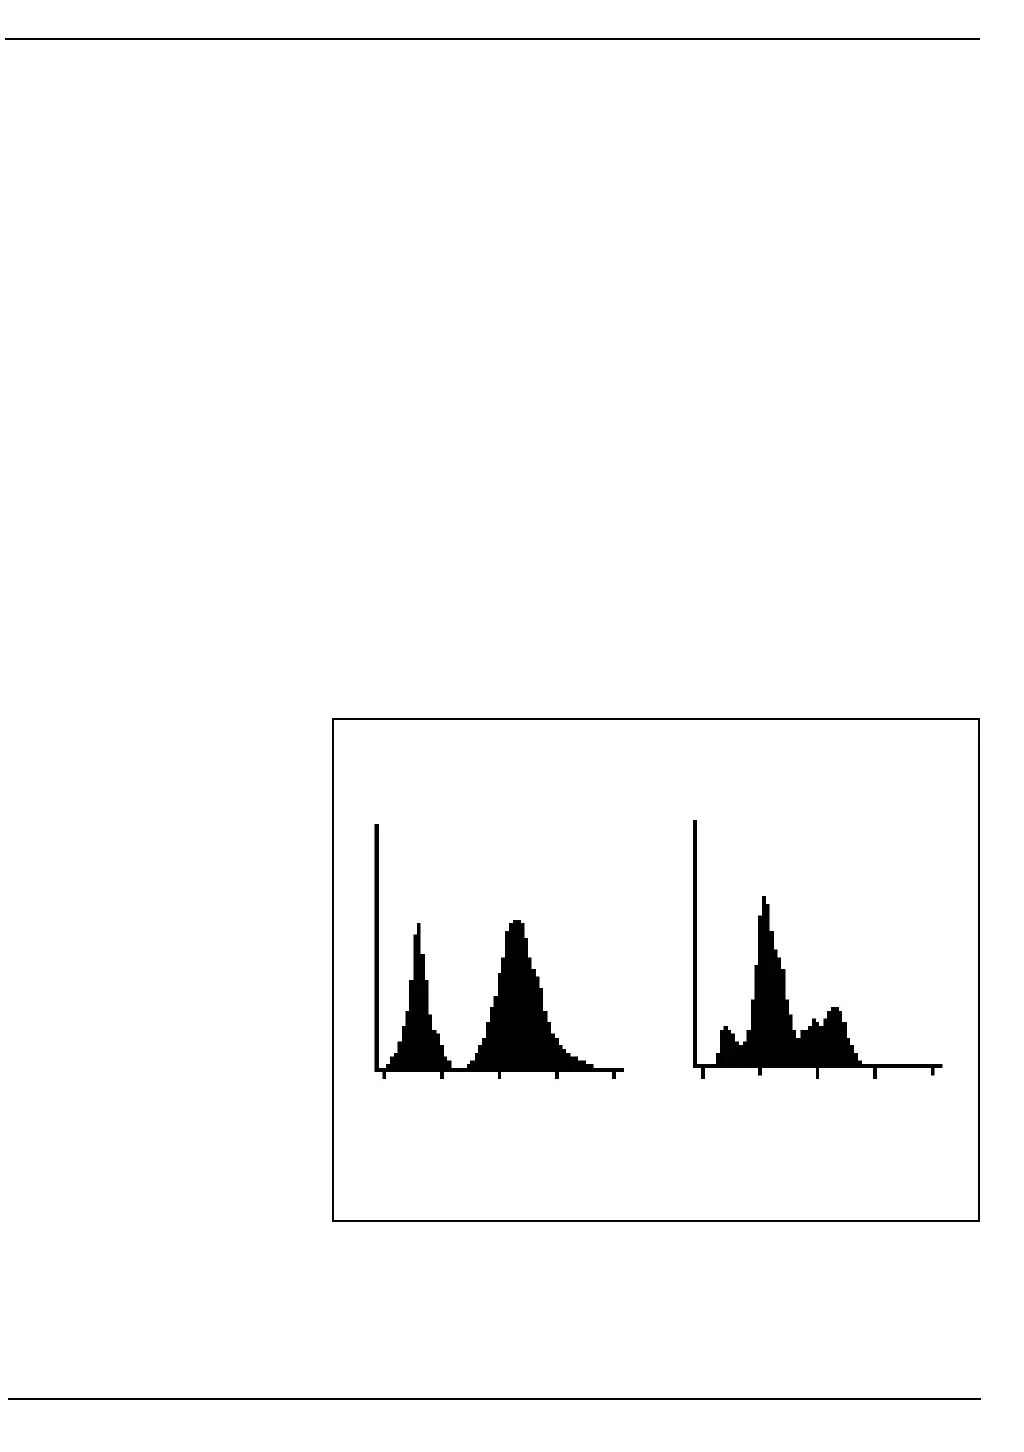
WBC Histograms
The CELL-DYN 3000 can present the WBC scatter information as two
histograms. (See Figure 3.7.) These histograms may be displayed and
printed at the operator's request.
Figure 3.7: WBC Histograms
MONO-POLY
LYM-BASO-MONO