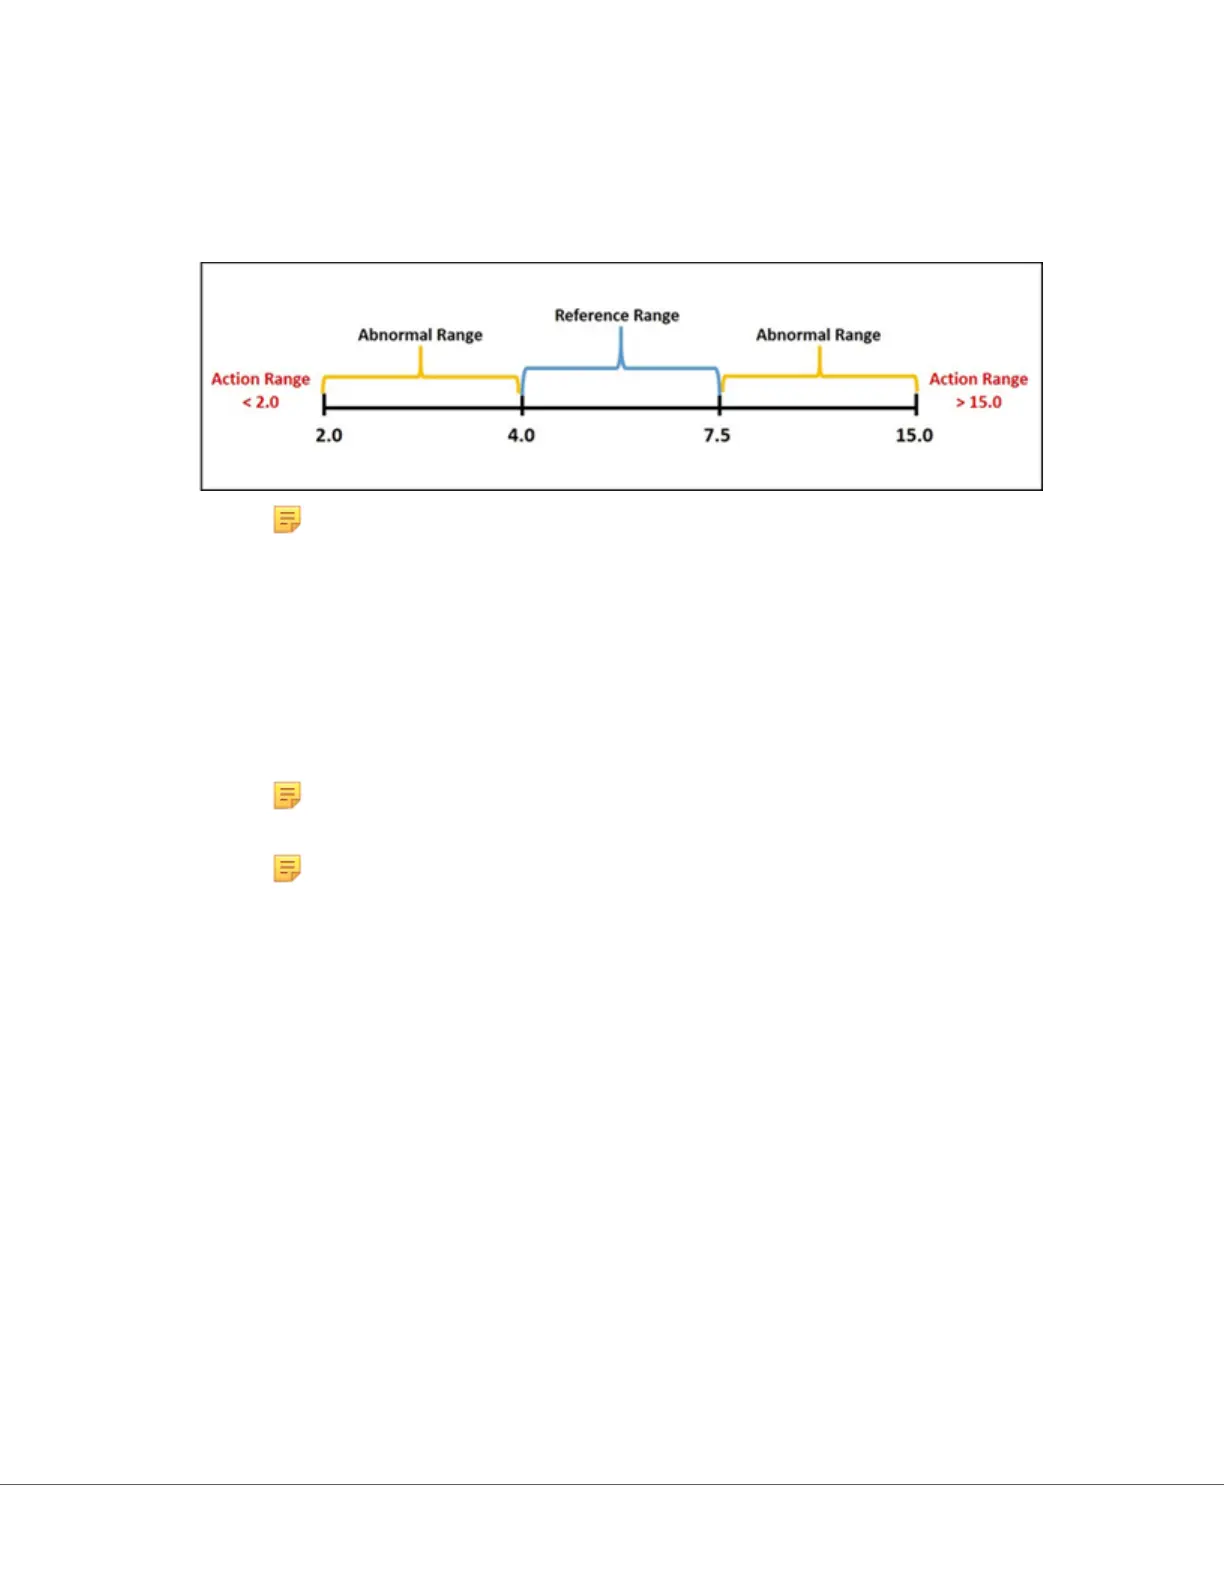
Below is an example of reference, abnormal and acon ranges. In this example, the reference range was
set as 4.0-7.5. The low acon range was set at 2.0 and the high acon range was set at 15.0. The
instrument calculates the abnormal range. When ranges are set and the prole is loaded onto the
instrument, the result screen will reect these changes. An example of a result screen displaying range
customizaon can be found in Interpreng Results with customizaon features applied.
Note: Ne
ver enter reference, acon or custom reportable ranges outside of the
manufacturers reportable range.
Custom Reportable Ranges
Restrict the display range to custom values. For example, healthcare organizaon managers may wish to
limit the display ranges to values that have been veried using calibraon vericaon materials. Set the
low and high values. Narrowing the reportable range of certain tests may aect the presentaon of
other dependent test results. In the table below, if any of the results in the rst column are outside the
reportable range, the dependent test results listed in the second column will be suppressed (displayed as
<>).
Note: Ne
ver enter a null (blank) value for the Custom Reportable range for Low or High.
The values can be le as -99999.9 for Low or 99999.9 for High.
Note: Rang
e customizaon may not apply to all cartridge types.
183
i-STAT Alinity — System Operaons Manual Art: 746300-01 Rev. N Rev. Date: 02-Nov-2022