54 1100 Series FD Reference Manual
2 First Steps with the Fluorescence Detector
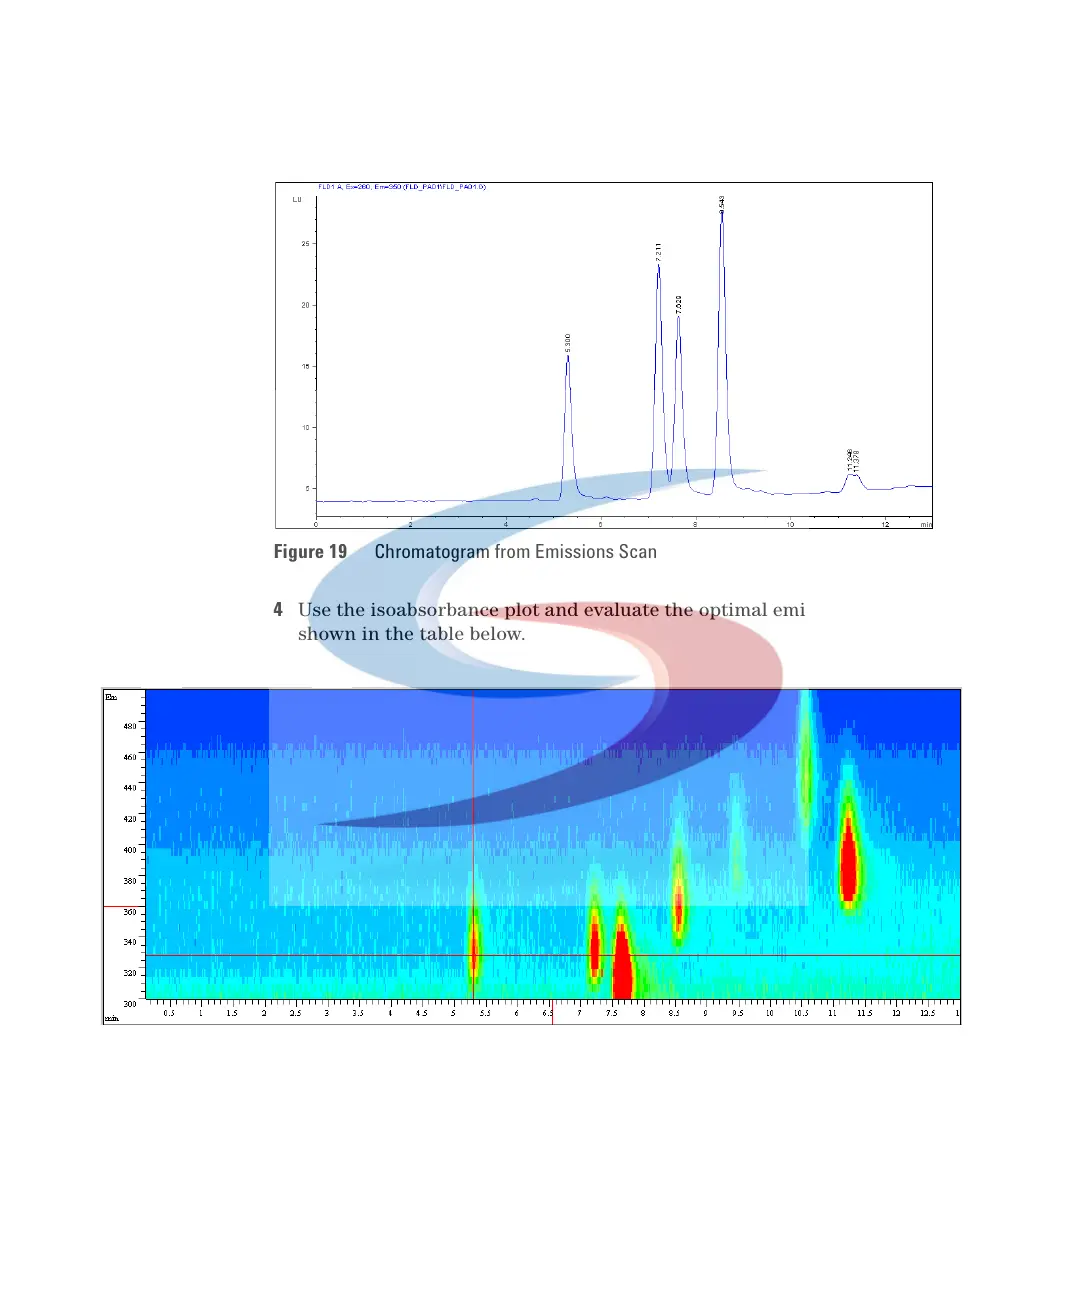
4 Use the isoabsorbance plot and evaluate the optimal emission wavelengths,
shown in the table below.
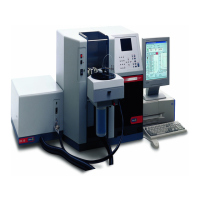
Figure 19 Chromatogram from Emissions Scan
Figure 20 Isoabsorbance Plot from Emission Scan
 Loading...