5Methods
108 Operation Manual
All conditions must be identical in the column compensation run and the real run. The same
detector and column must be used, operating under the same temperature and gas flow
conditions.
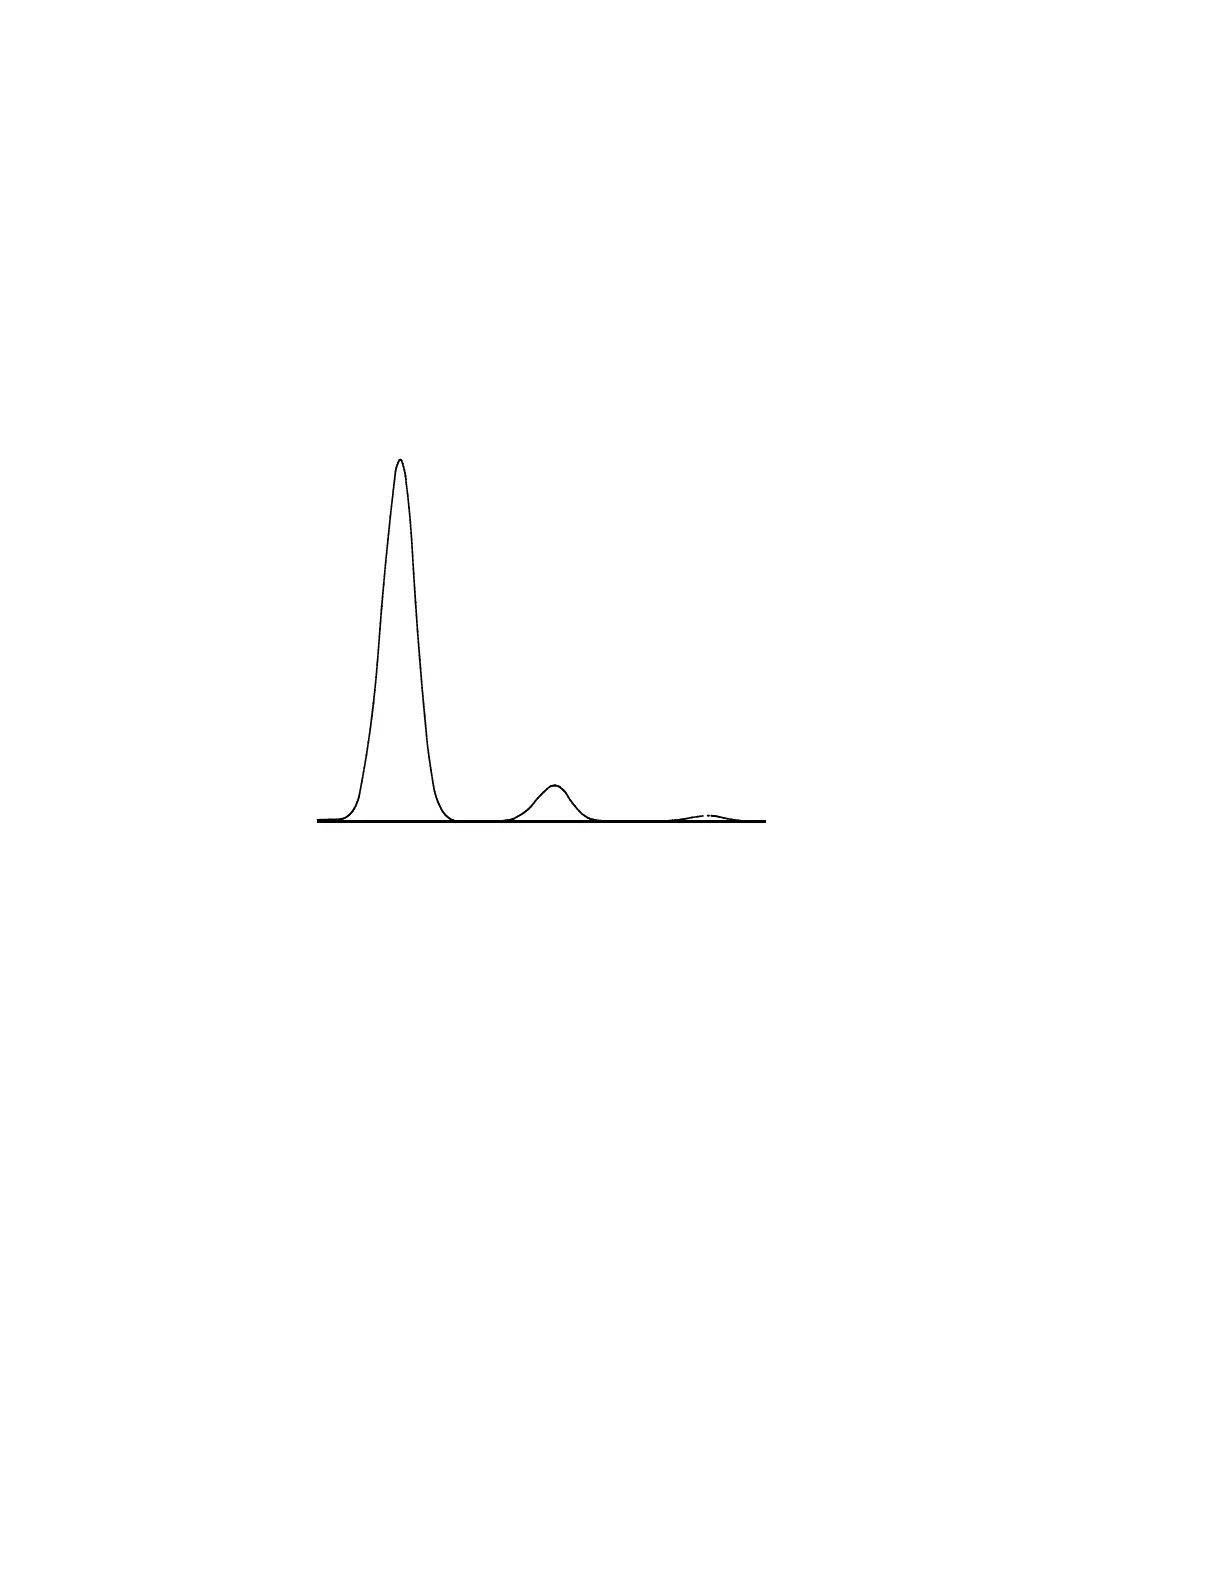
Test plot
Test plot is an internally generated “chromatogram” that can be assigned to a signal output
channel. It consists of three baseline-resolved, repeating peaks. The area of the largest is
approximately 1 Volt-sec, the middle one is 0.1 times the largest, and the smallest is 0.01 times
the largest.
Test plot can be used to verify the operation of external data processing devices without
having to perform repeated chromatographic runs. It may also be used as a stable signal to
compare the results from different data processing devices.
To use the Test Plot:
1 Select Method > Analog Out.
2 Select the dropdown under Signal Type.
3 Select Test Plot.
Test Plot is the default choice for the analog outputs. Test Plot can also be selected as a digital
signal when using the Browser Interface or a data system.

 Loading...