Send documentation comments to mdsfeedback-doc@cisco.com
8-6
Cisco MDS 9000 Family Troubleshooting Guide, Release 3.x
OL-9285-05
Chapter 8 Troubleshooting Ports
Overview of the FC-MAC Driver and the Port Manager
Troubleshooting Port States with the Device Manager
Device Manager offers multiple ways to monitor ports, including:
• Device View
• Summary View
• Port Selection
• Port Monitoring
Device View
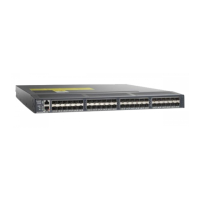
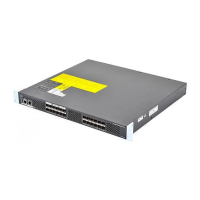
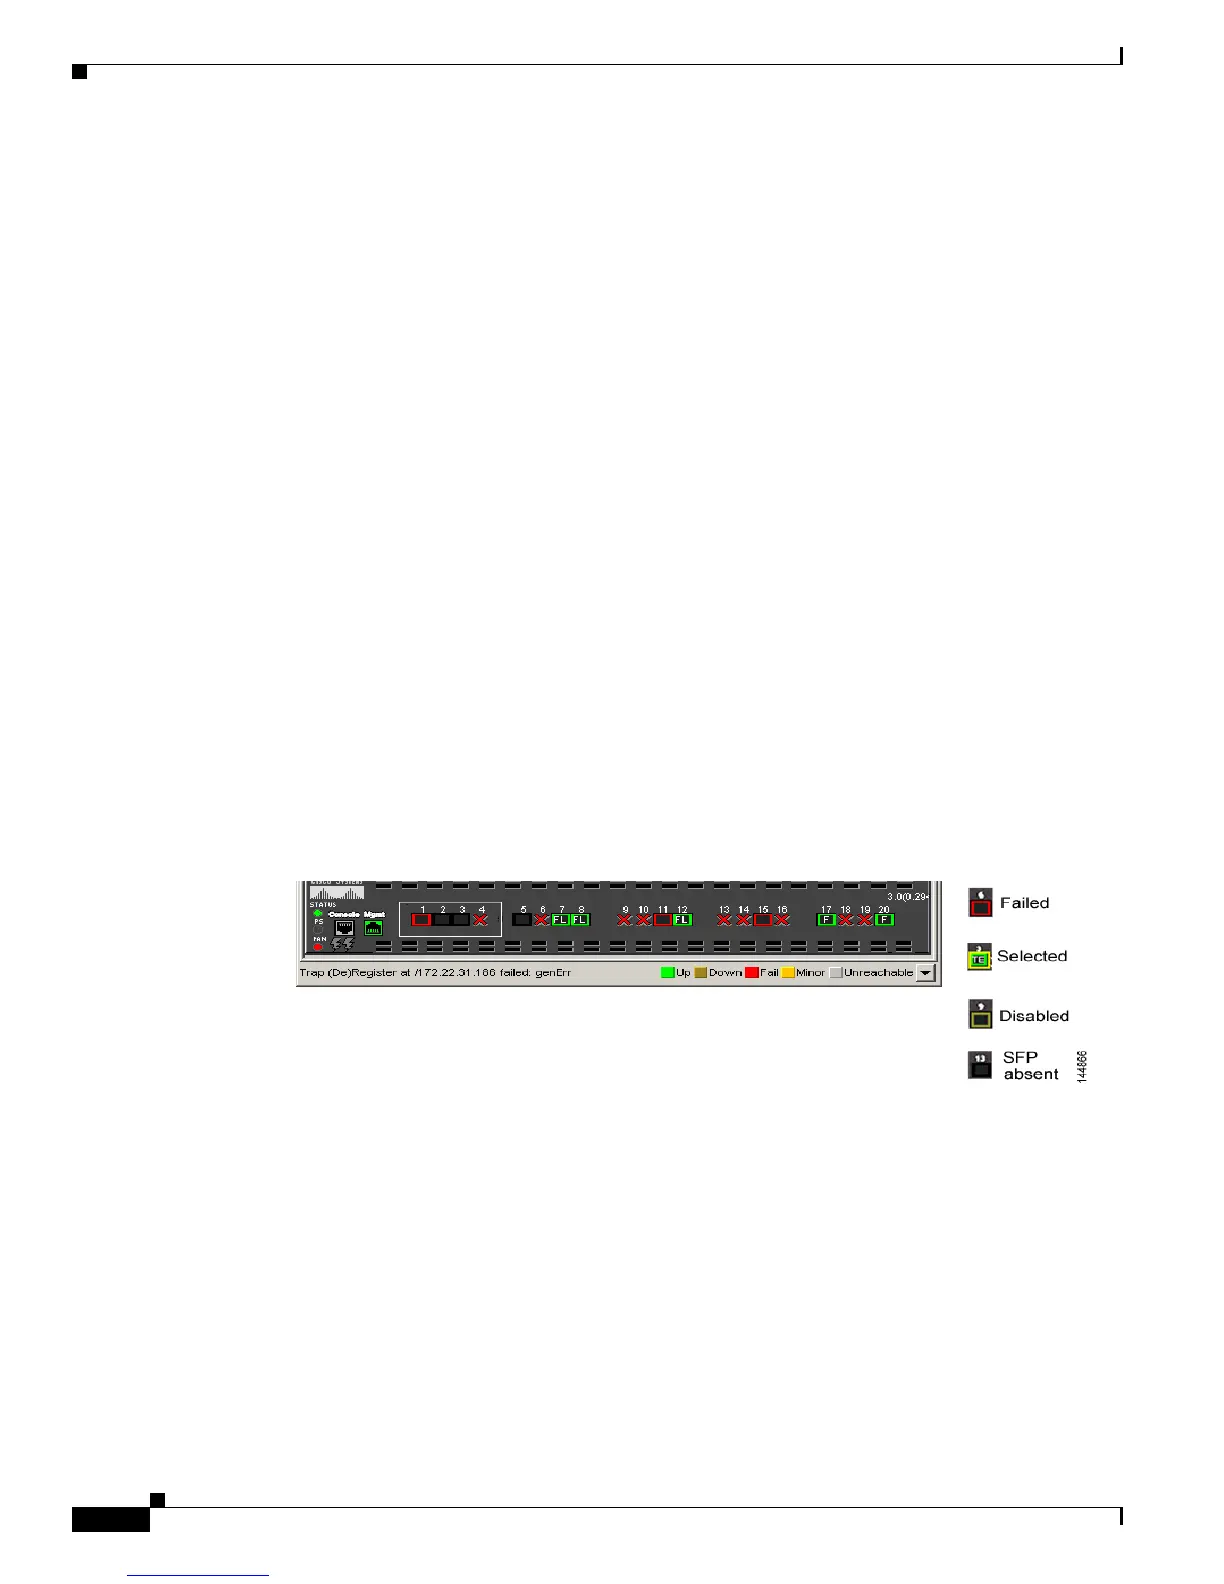
Basic port monitoring using Device Manager begins with the visual display in the Device View
(Figure 8-1). Port display descriptions include:
• Green box—A successful fabric login has occurred; the connection is active.
• Red X—A small form-factor pluggable transceiver (SFP) is present but there is no connection. This
could indicate a disconnected or faulty cable, or no active device connection.
• Red box—An FSP is present but fabric login (FLOGI) has failed. Typically a mismatch in port or
fabric parameters with the neighboring device. For example, a port parameter mismatch would occur
if a node device were connected to a port configured as an E port. An example of a fabric parameter
mismatch would be differing timeout values.
• Yellow box—In Device Manager, a port was selected.
• Gray box—The port is administratively disabled.
• Black box—FSP is not present.
Figure 8-1 Device Manager: Device View
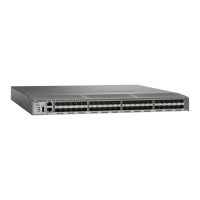
Device Manager: Summary View
In Device Manager, selecting the Summary View (Figure 8-2) expands on the information available for
port monitoring. The display includes:
• VSAN assignment
• For N ports, the port world-wide name (pWWN) and Fibre Channel ID (FC ID) of the connected
device
• For ISLs, the IP address of the connected switch
• Speed
• Frames transmitted and received
 Loading...