Send documentation comments to mdsfeedback-doc@cisco.com
8-8
Cisco MDS 9000 Family Troubleshooting Guide, Release 3.x
OL-9285-05
Chapter 8 Troubleshooting Ports
Overview of the FC-MAC Driver and the Port Manager
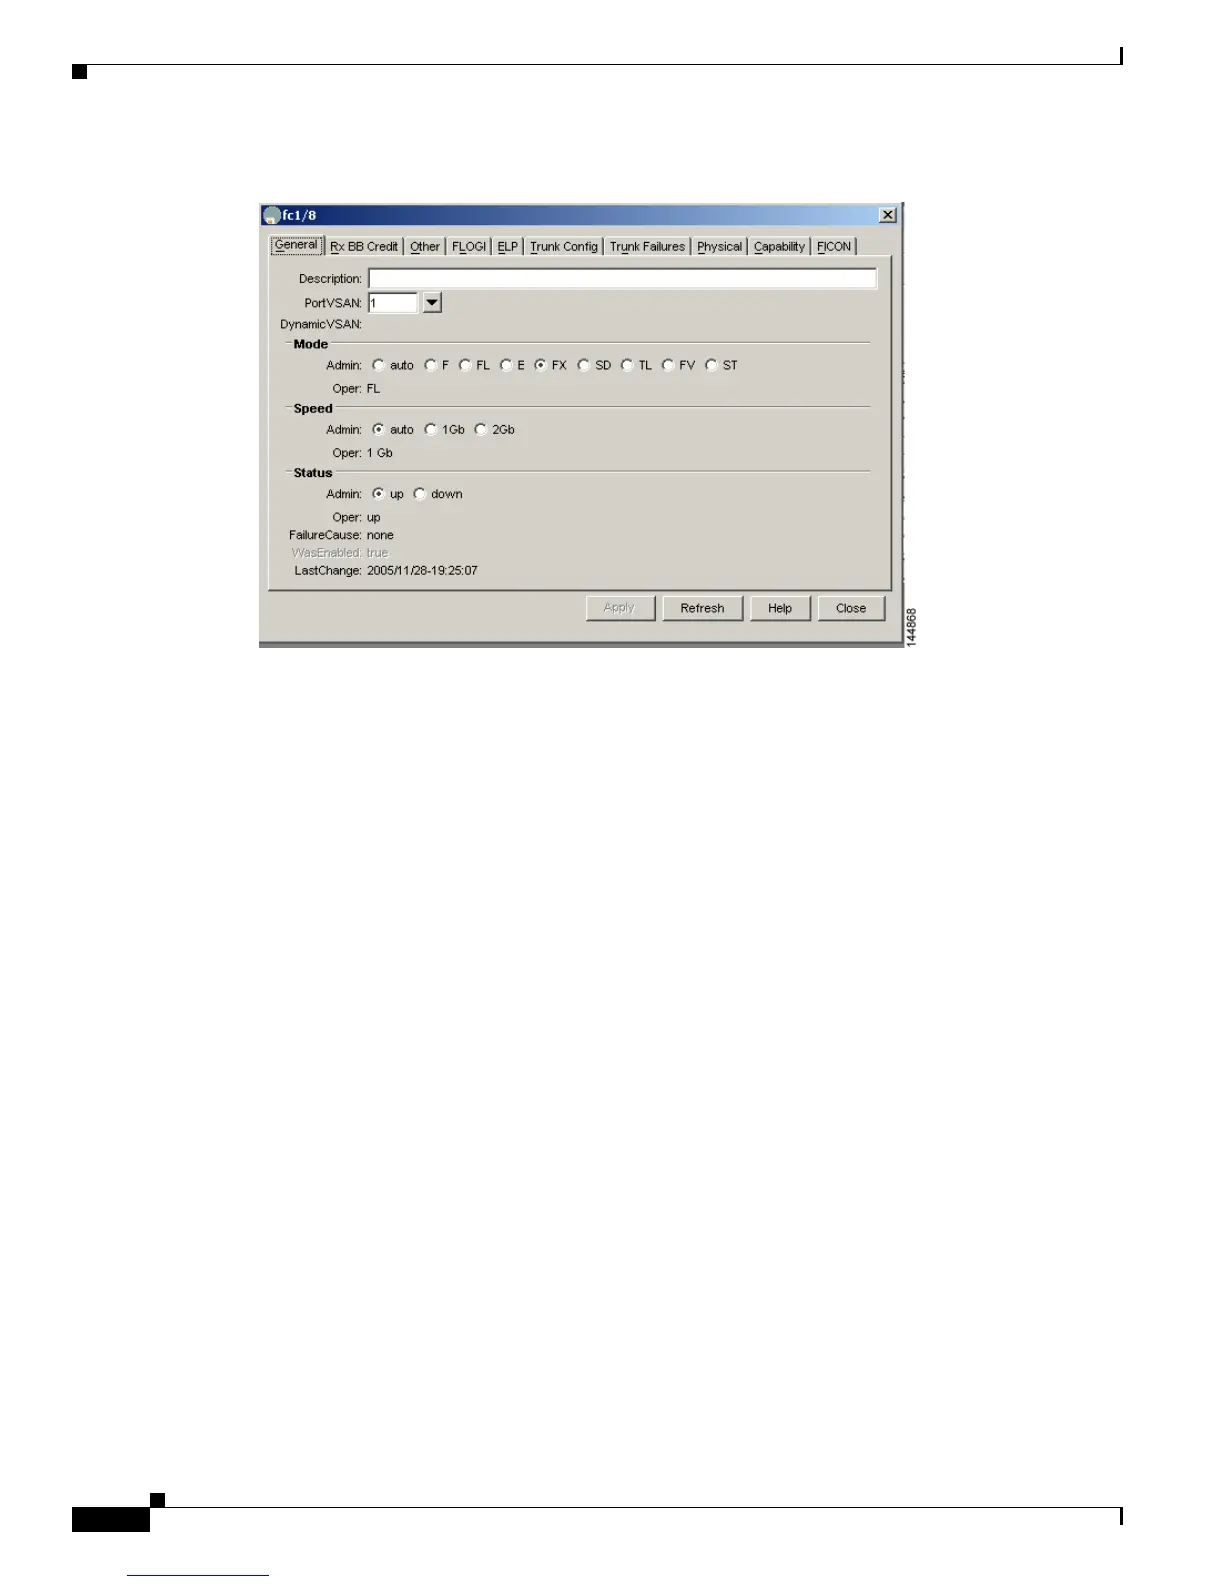
Figure 8-3 Device Manager: Port Selection
Device Manager: Port Monitoring
To display additional details about port traffic, use the Device View or Summary View. In Device View,
choose one or more ports, right-click and choose Monitoring from the pop-up menu. In Summary View,
choose one or more interfaces, and click the Monitor tool. The initial display (Figure 8-4) shows traffic
information for the selected interval, including the number of bytes and frames received and transmitted.
Additional tabs include:
• Protocol—View protocol-related traffic and error statistics, including link reset counts, offline and
non-operational sequence errors, reset protocol errors, and statistics related to buffer-to-buffer flow
control.
• Discards—View the number of frames discarded by the port, including Class 2, Class 3, and Class
F frames, EISL frames, and totals.
• Link Errors—View the number of link errors, including link failures, signal losses, synchronization
failures, invalid transmission words, and delimiter and address identifier errors.
• Frame Errors—View frame error statistics, including the number of frames with invalid CRC, Class
3 frames that were discarded upon reception, FBSY returns for selected situations, and FRJT returns
resulting from frame rejection by fabric.
• Class 2 Traffic—View the amount of Class 2 traffic for the selected interval.
• Class 2 Errors—View error statistics for Class 2 traffic, including busy frame responses and port
rejects.
• FICON—View FICON error statistics, including pacing, disparity, EOF, OOF, and order sets errors.
 Loading...