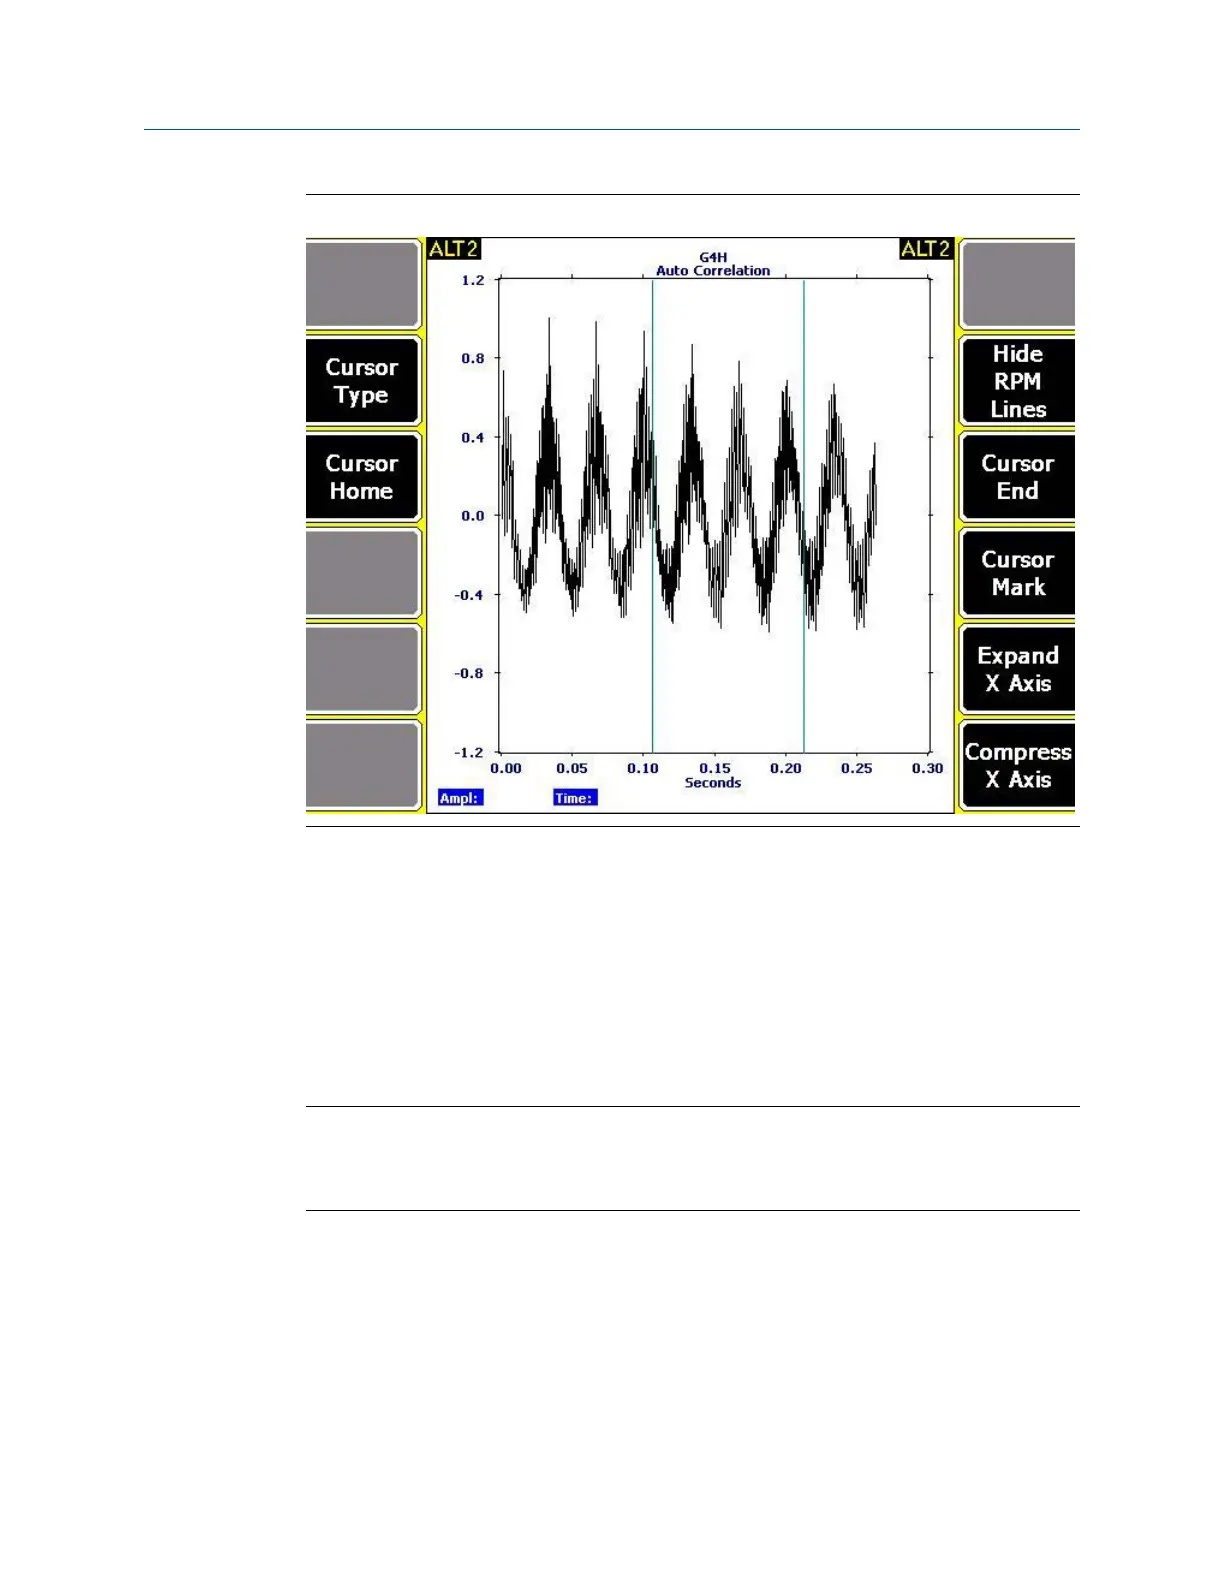
Waveform with Auto Correlation plot set to show RPM linesFigure 6-2:
6.9.2 Collect a spectrum
A spectrum shows all of the frequencies and amplitudes of a machine, within the specified
limits of the Fmax and Fmin values. The vibration spectrum is the basic tool for
understanding vibration.
A vibration spectrum is a graph of vibration amplitude versus vibration frequency. The
vibration spectrum shows the frequencies at which the component is vibrating and the
amplitude of vibration at each of these frequencies.
Note
You can measure velocity in most situations. However, for low frequencies (below 1,800 cpm),
displacement spectra are more informative. For high frequencies (above 60,000 cpm), acceleration
spectra are more informative.
Procedure
1. Create a job or open Analyze from a route measurement point.
2. From the Analyze main menu, press F1 Manual Analyze > F1 Set Analyze Mode.
3. Use the up and down arrow keys to select Spectra.
4. Press Enter.
Analyze and Advanced Analyze
140 MHM-97432 Rev 7
 Loading...


