FortiGate Version 3.0 MR4 Administration Guide
428 01-30004-0203-20070102
Reports Log&Report
Reports
The FortiAnalyzer reporting features are now more integrated with the FortiGate
unit. From the Log&Report menu, you can configure a simple FortiAnalyzer report,
view the report, and print the report. You can even view content archive logs
stored on the FortiAnalyzer unit.
You can configure basic traffic reports from the Log&Report menu. Basic traffic
reports use the log information stored in your FortiGate memory to present basic
traffic information in a graphical format.
Basic traffic reports
The FortiGate unit uses collected log information and presents it in graphical
format to show network usage for a number of services. The charts show the
bytes used for the service traffic.
You can view logs from Log&Report > Report Access > Memory.
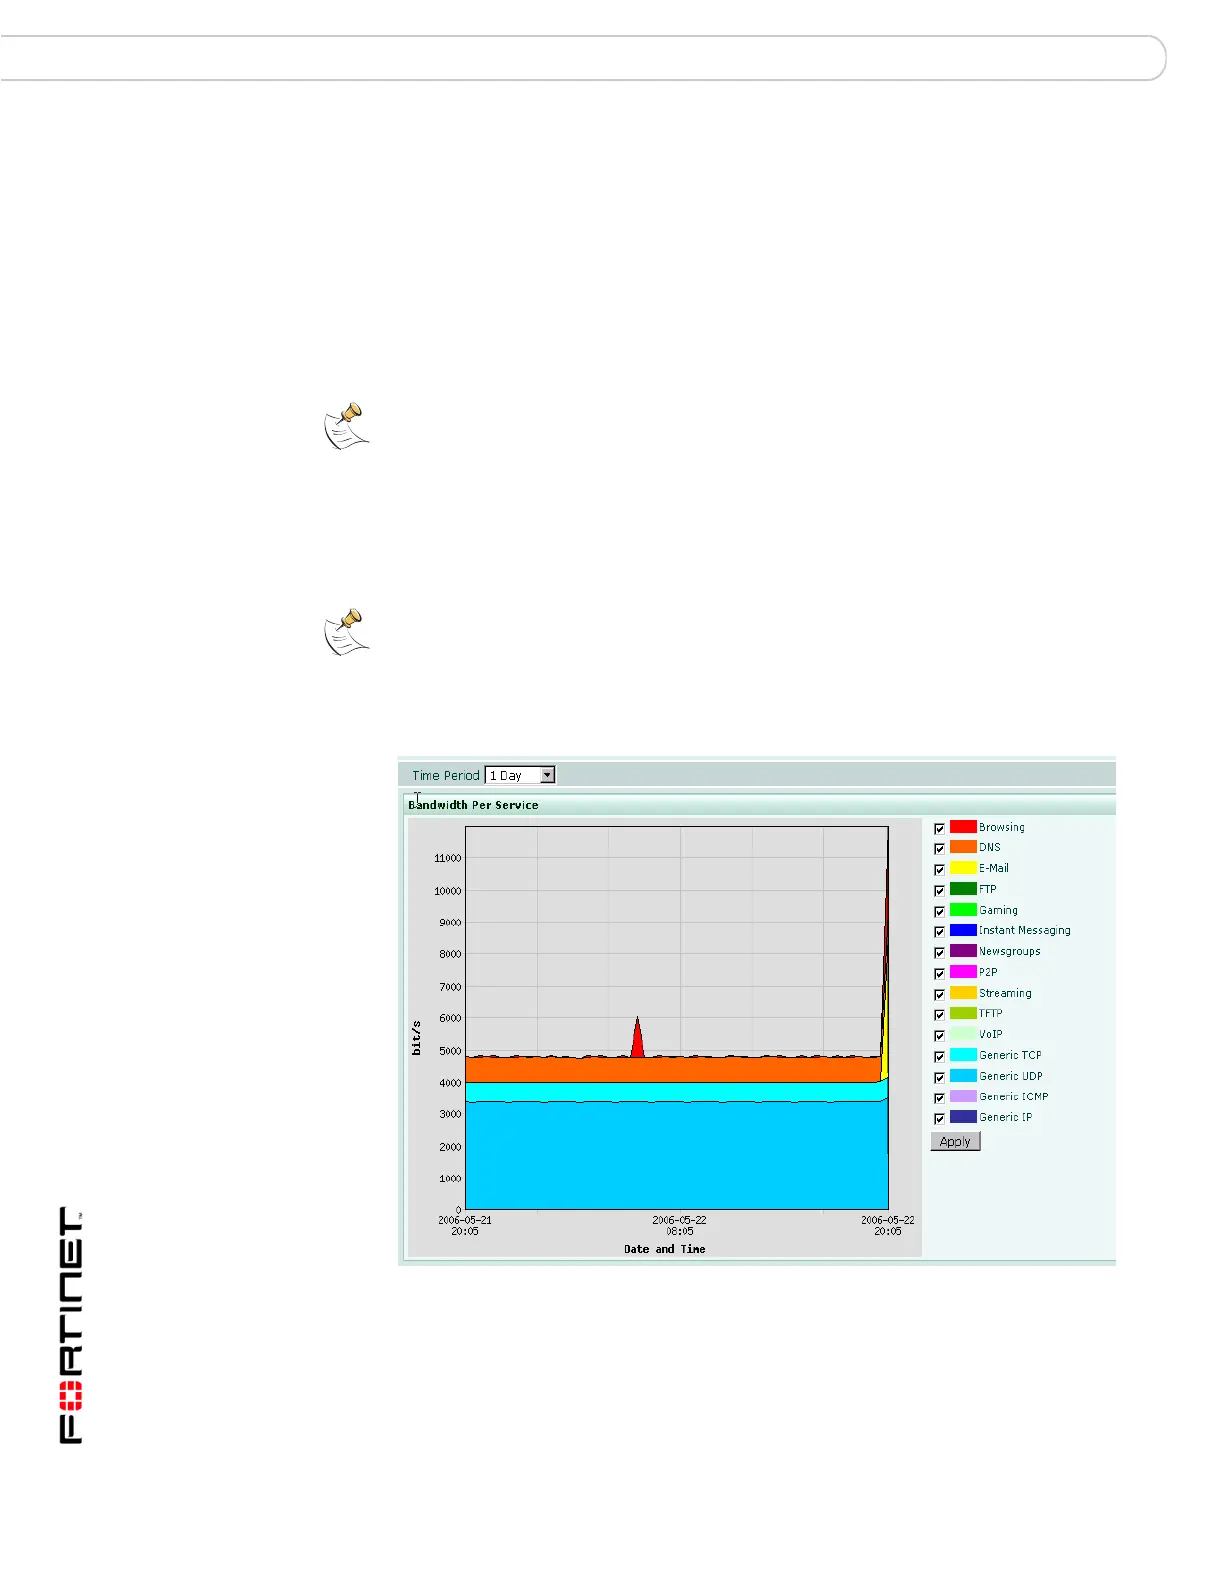
Figure 285:Viewing the Bandwidth Per Service graph
Note: If VDOMs are enabled, make sure the VDOM you are currently in allows access to
configure, view, edit and/or print reports. Certain VDOMs may only allow you to access
certain FortiGate features.
Note: The data used to present the graphs is stored in memory. When the FortiGate unit is
reset or rebooted, the data is erased.
Time Period Select a time range to view for the graphical analysis. You can choose
from one day, three days, one week or one month. The default is one
day. When you refresh your browser or go to a different menu, the
settings revert to default.
 Loading...