System Status Changing system information
FortiGate Version 3.0 MR4 Administration Guide
01-30004-0203-20070102 49
The information displayed in the statistics section is saved in log files that can be
saved to a FortiAnalyzer unit, saved locally or backed up to an external source.
You can use this data to see trends in network activity or attacks over time and
deal with it accordingly.
For detailed procedures involving the statistics list, see “Viewing Statistics” on
page 54.
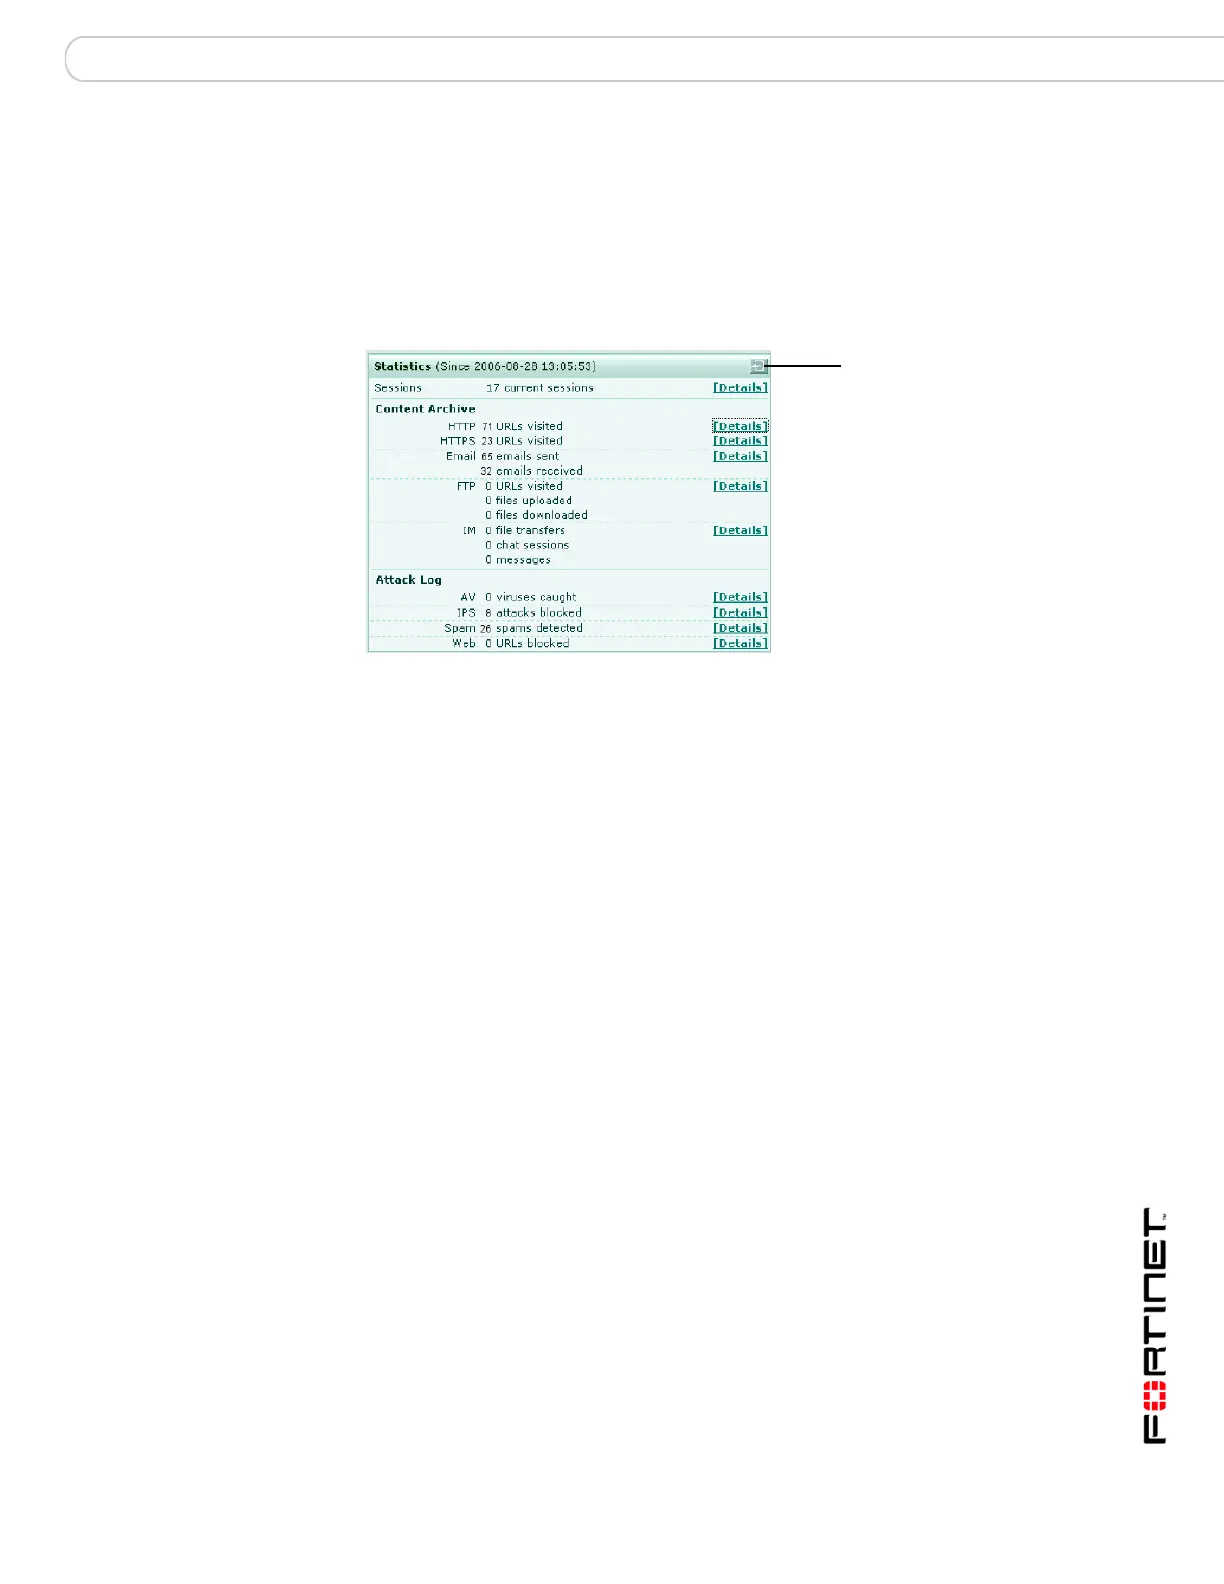
Figure 16: Example Statistics
Changing system information
FortiGate administrators whose access profiles permit write access to system
configuration can change the system time, host name and the operation mode for
the VDOM.
Configuring system time
1 Go to System > Status.
2 In the System Information section, select Change on the System Time line.
3 Select the time zone and then either set the date and time manually or configure
synchronization with an NTP server.
Since The date and time when the counts were reset.
Counts are reset when the FortiGate unit reboots or when you
select to the reset icon.
Reset Icon Reset the Archive and Attack Log counts to zero.
Sessions The number of communications sessions being processed by the
FortiGate unit. Select Details for detailed information. See “Viewing
the session list” on page 54.
Content Archive A summary of the HTTP, e-mail, FTP, and IM/P2P traffic that has
passed through the FortiGate unit. The Details pages list the last 64
items of the selected type and provide links to the FortiAnalyzer unit
where the archived traffic is stored. If logging to a FortiAnalyzer unit
is not configured, the Details pages provide a link to the
Log & Report > Log Config > Log Settings page.
Attack Log A summary of viruses, attacks, spam email messages and URLs
the unit has intercepted. The Details pages list the most recent 10
items, providing the time, source, destination and other information.
Reset
 Loading...