System Status Status page
FortiGate Version 3.0 MR4 Administration Guide
01-30004-0203-20070102 47
Interface Status
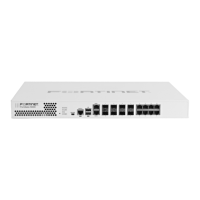
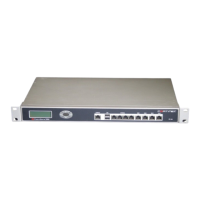
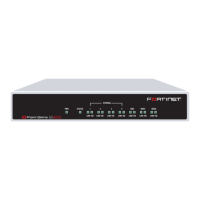
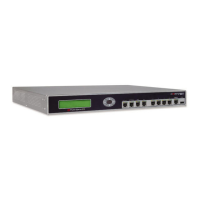
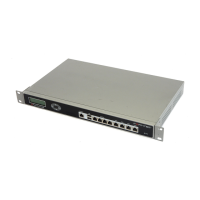
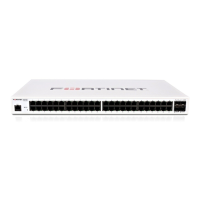
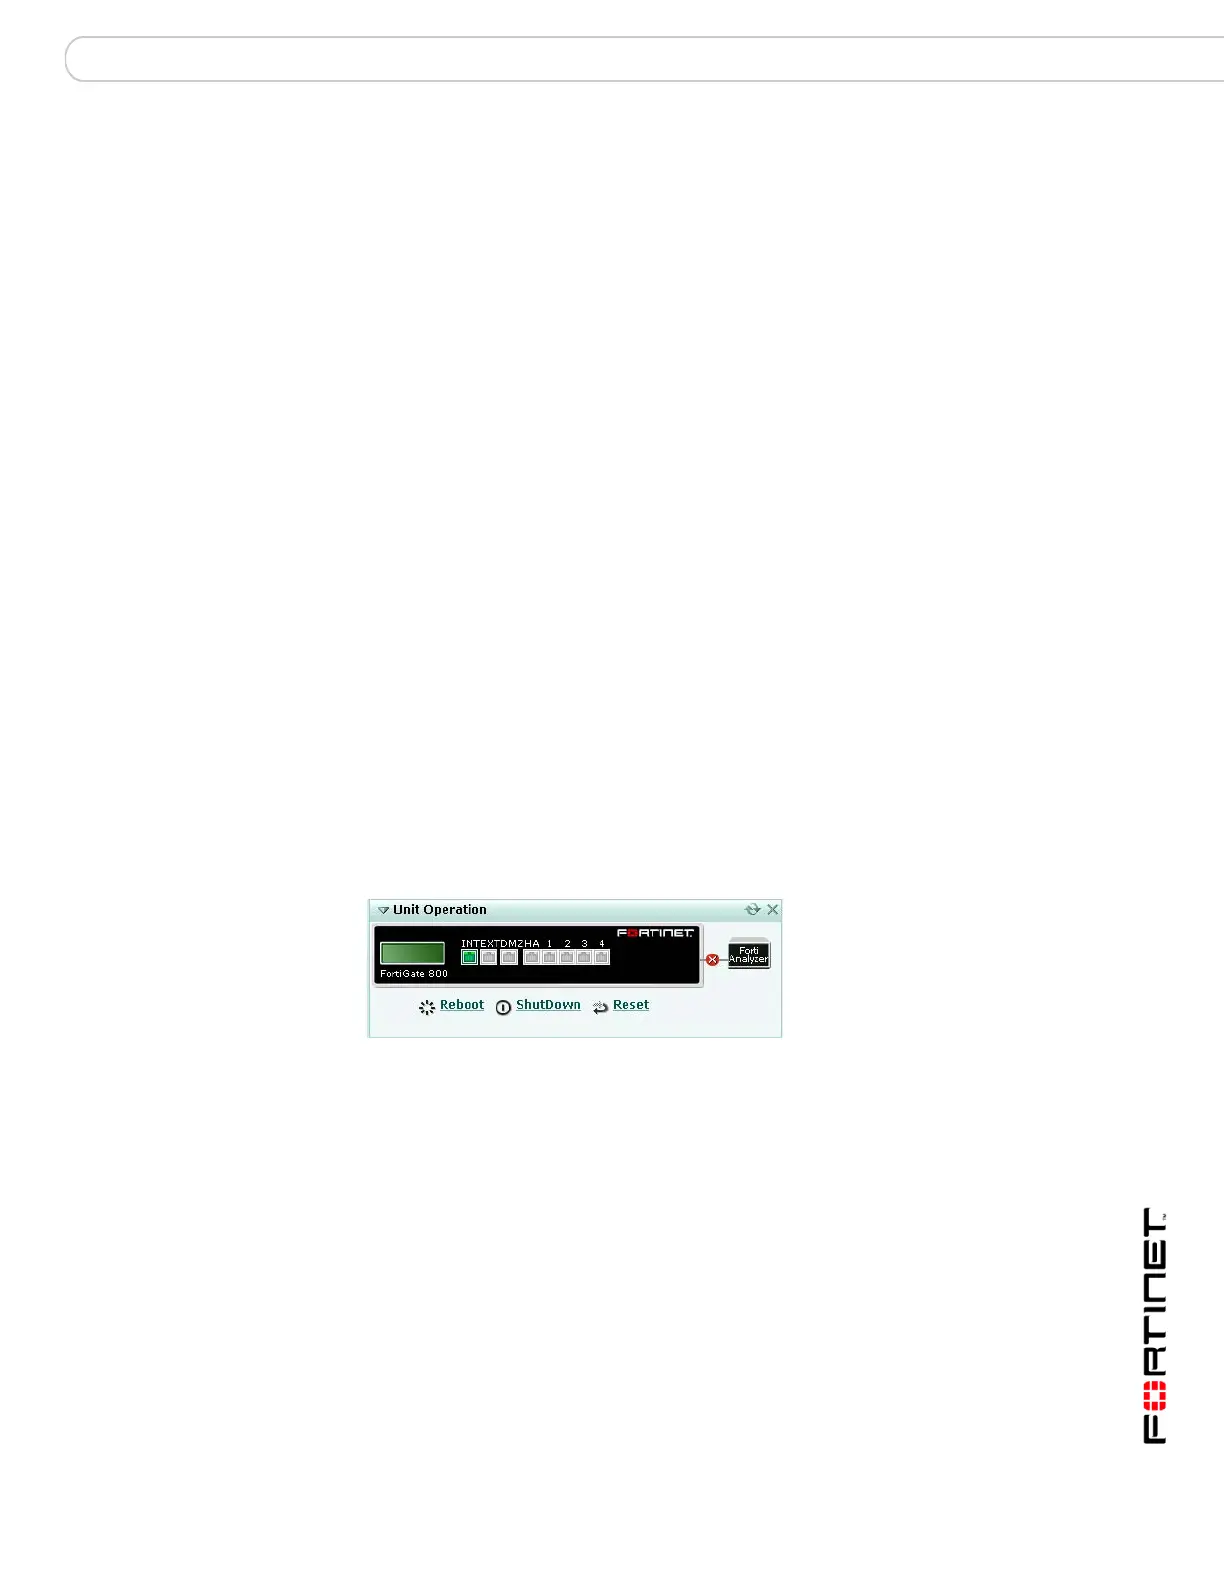
An illustration of the FortiGate unit front panel shows the status of the unit’s
ethernet interfaces. If a network interface is shaded green, that interface is
connected. Pause the mouse pointer over the interface to view the IP address,
netmask and current status of the interface.
If you select Reboot or ShutDown a window will open allowing you to enter the
reason for the system event. Your reason will be added to the Disk Event Log.
Disk logging will need to be enabled in the CLI. Event Logging and Admin Events
need to be enabled. For more information on Event Logging, see “Event log” on
page 416.
Figure 14: Example FortiGate-800 interface status (with no FortiAnalyzer)
History icon View a graphical representation of the last minute of CPU, memory,
sessions, and network usage. This page also shows the virus and
intrusion detections over the last 20 hours. For more information
see “Viewing operational history” on page 52.
CPU Usage The current CPU status displayed as a dial gauge and as a
percentage.
The web-based manager displays CPU usage for core processes
only. CPU usage for management processes (for example, for
HTTPS connections to the web-based manager) is excluded.
Memory Usage The current memory status displayed as a dial gauge and as a
percentage.
The web-based manager displays memory usage for core
processes only. Memory usage for management processes (for
example, for HTTPS connections to the web-based manager) is
excluded.
FortiAnalyzer Disk
Quota
The current status of the FortiAnalyzer disk quota used for the
FortiGate unit displayed as a pie chart and a percentage.
This is available only if you have configured logging to a
FortiAnalyzer unit.
INT / EXT / DMZ / HA /
1 / 2 / 3 / 4
The ports on the FortiGate unit. The names and number of these
ports will vary with your unit.
The icon below the port name indicates its status by its color.
Green indicates the port is connected. Grey indicates there is no
connection.
For more information about a port’s configuration position your
mouse over the icon for that port. You will see the full name of the
interface, the IP address and netmask, the status of the link, the
speed of the interface, and the number of sent and received
packets.
FortiAnalyzer The icon on the link between the FortiGate unit graphic and the
FortiAnalyzer graphic indicates the status of their connection. An
‘X’ on a red icon indicates there is no connection. A check mark on
a green icon indicates there is communication between the two
units.
Select the FortiAnalyzer graphic to configure FortiAnalyzer logging
on your FortiGate unit. See “Log&Report” on page 407.
 Loading...