FlexLine plus, User Interface
33
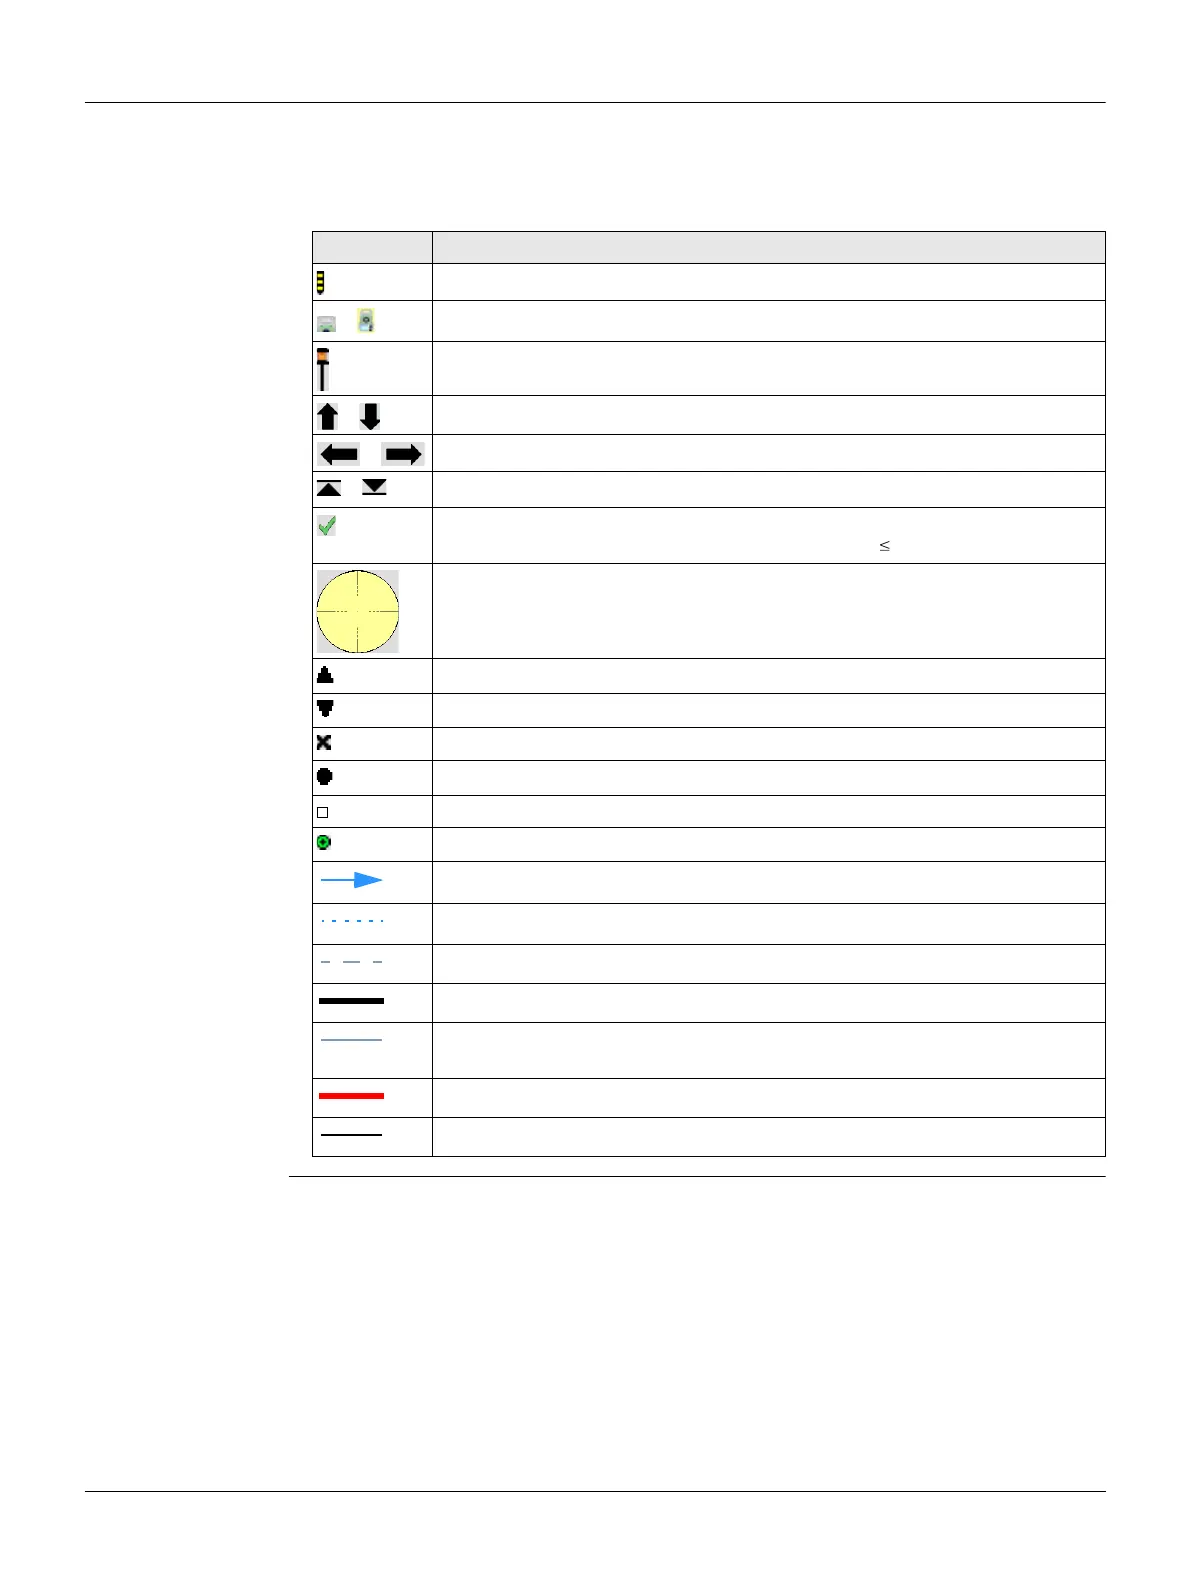
3.7 Graphic Symbols
Graphic symbols In some programs, a graphical display is shown. The graphical display
• provides a guide to find the point to be staked out.
• allows for a better overall understanding of how the data being used and meas-
ured relates to each other.
Element Description
Point to be staked / known point
/
Instrument
Current position of prism (measurement with Dist)
/
Forward/backwards distance to point
/
Side distance to point
/
Height distance to point
The stakeout point is the same as the measured point. The difference
between stakeout point and measured point is 0.03 m.
Circle around the stake out point, supporting the detail view, radius =
0.5 m
Fixpoint
Station
Centre point of an arc or circle
Measured point
Black squares around the point symbol indicate the plane points.
New point
Reference line/arc, straight, curve or spiral from start point to end point
Extension of reference line/arc, straight, curve or spiral
Perpendicular distance to the reference line/arc, straight, curve or spiral
Boundary of an area
Connection between last measured/selected point and first point of an
area
Boundary of breaklines
Breaklines of an area