Moog Animatics SmartMotor™ Developer's Guide,Rev. L
Page 79 of 909
4.
After you've completed the entries, click Add and the custom parameter will be added to
the Chart View window.
5.
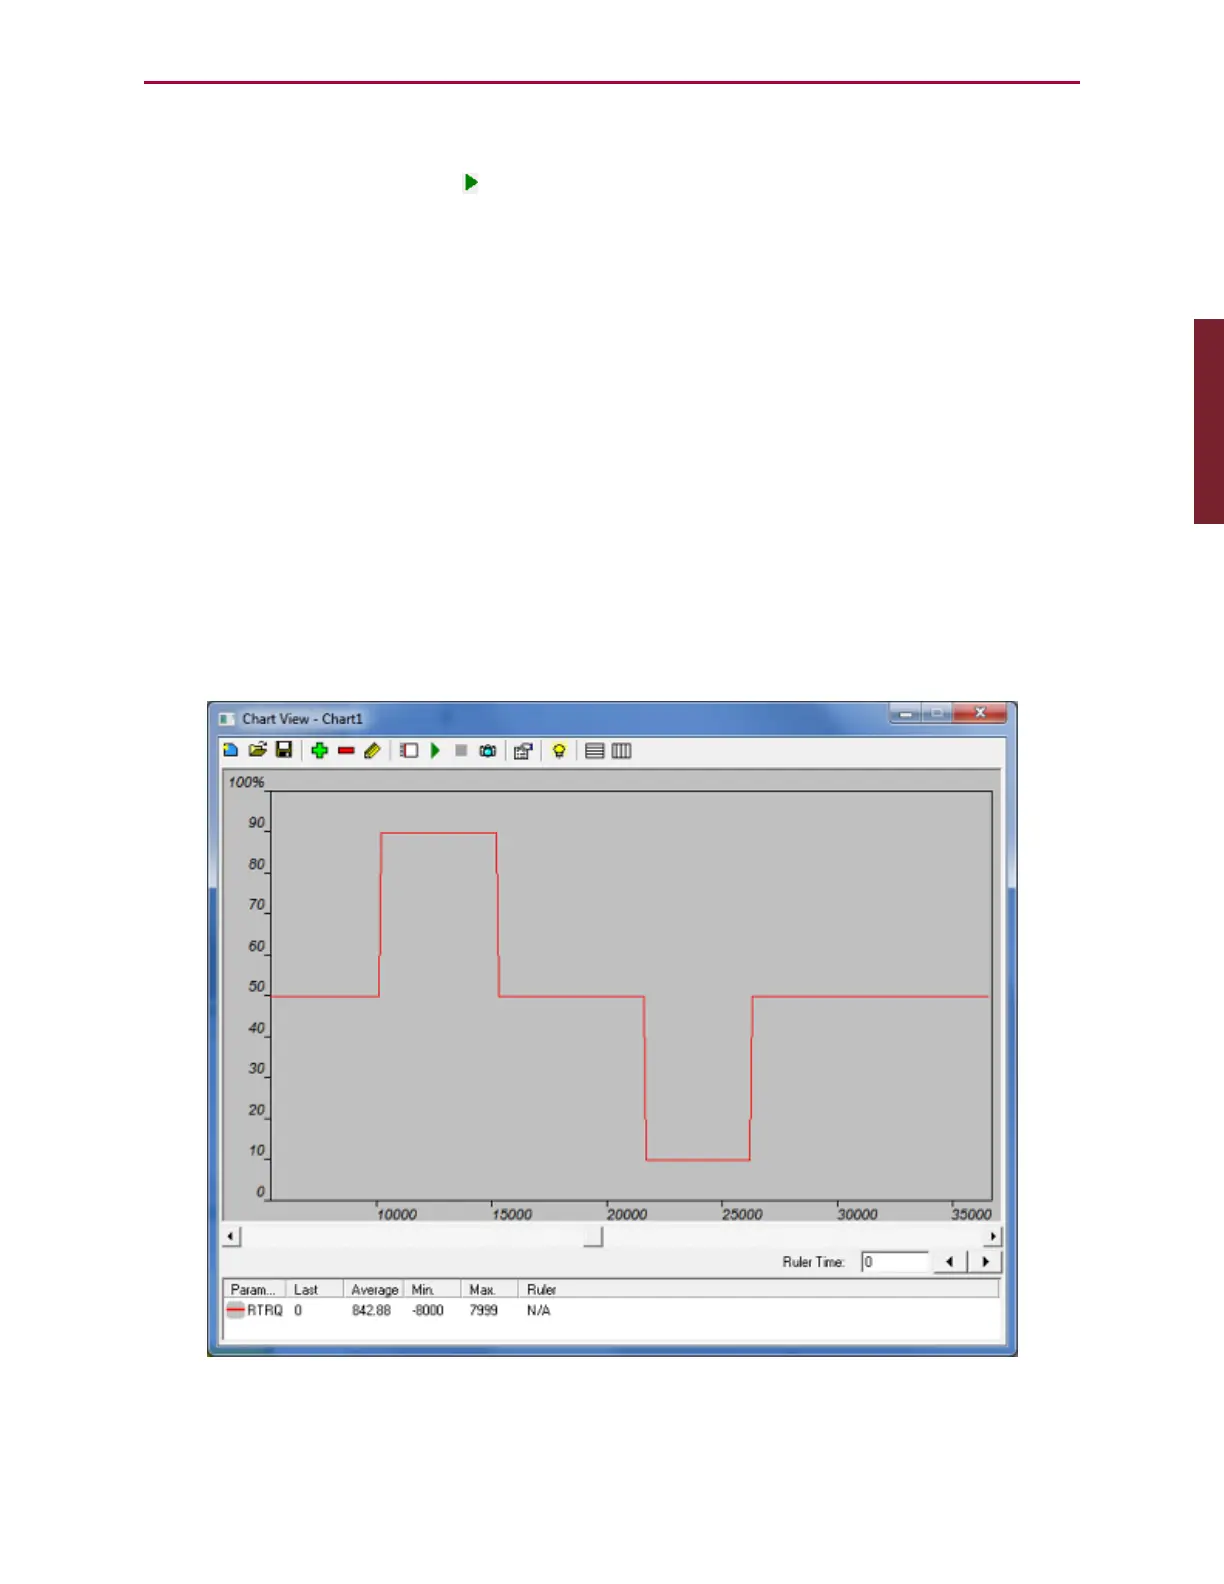
Click the green Play icon ( ); the chart recorder plots the RTRQ value.
6.
In the SMI software Terminal window, enter the following commands:
MT
T=0
G
T=8000
G
T=0
G
T=-8000
G
T=0
G
The Chart View tool plots a line similar to the one shown in the following figure.
Plotted RTRQ Values
Part 1: Programming: Chart View Example