Chapter 2: Troubleshooting Your Library
Working With Tickets
Quantum Scalar i6000 User’s Guide 87
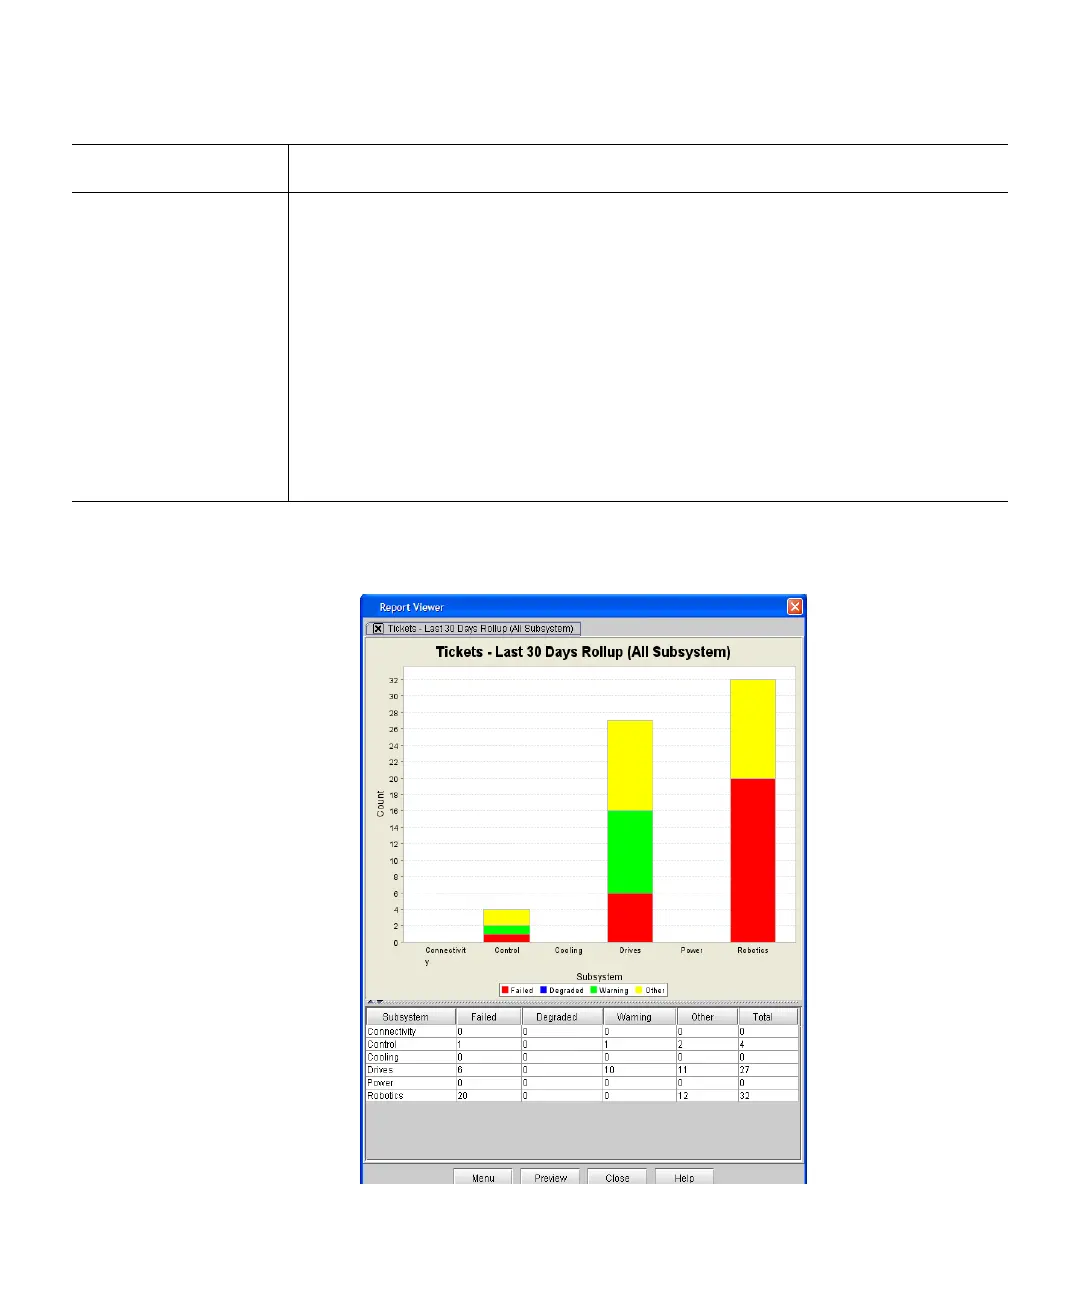
4 Click View. The Report Viewer dialog box appears. The content and
appearance of the report varies depending on the selected criteria.
Chart Determines the type of chart. Choices include:
•Area
•Bar
•Bar 3D
•Line
• Stacked Area
•Stacked Bar (default)
•Stacked Bar 3D
•Pie
•Pie 3D
Criteria (Continued) Description
 Loading...