X35 Console Overview
2.11
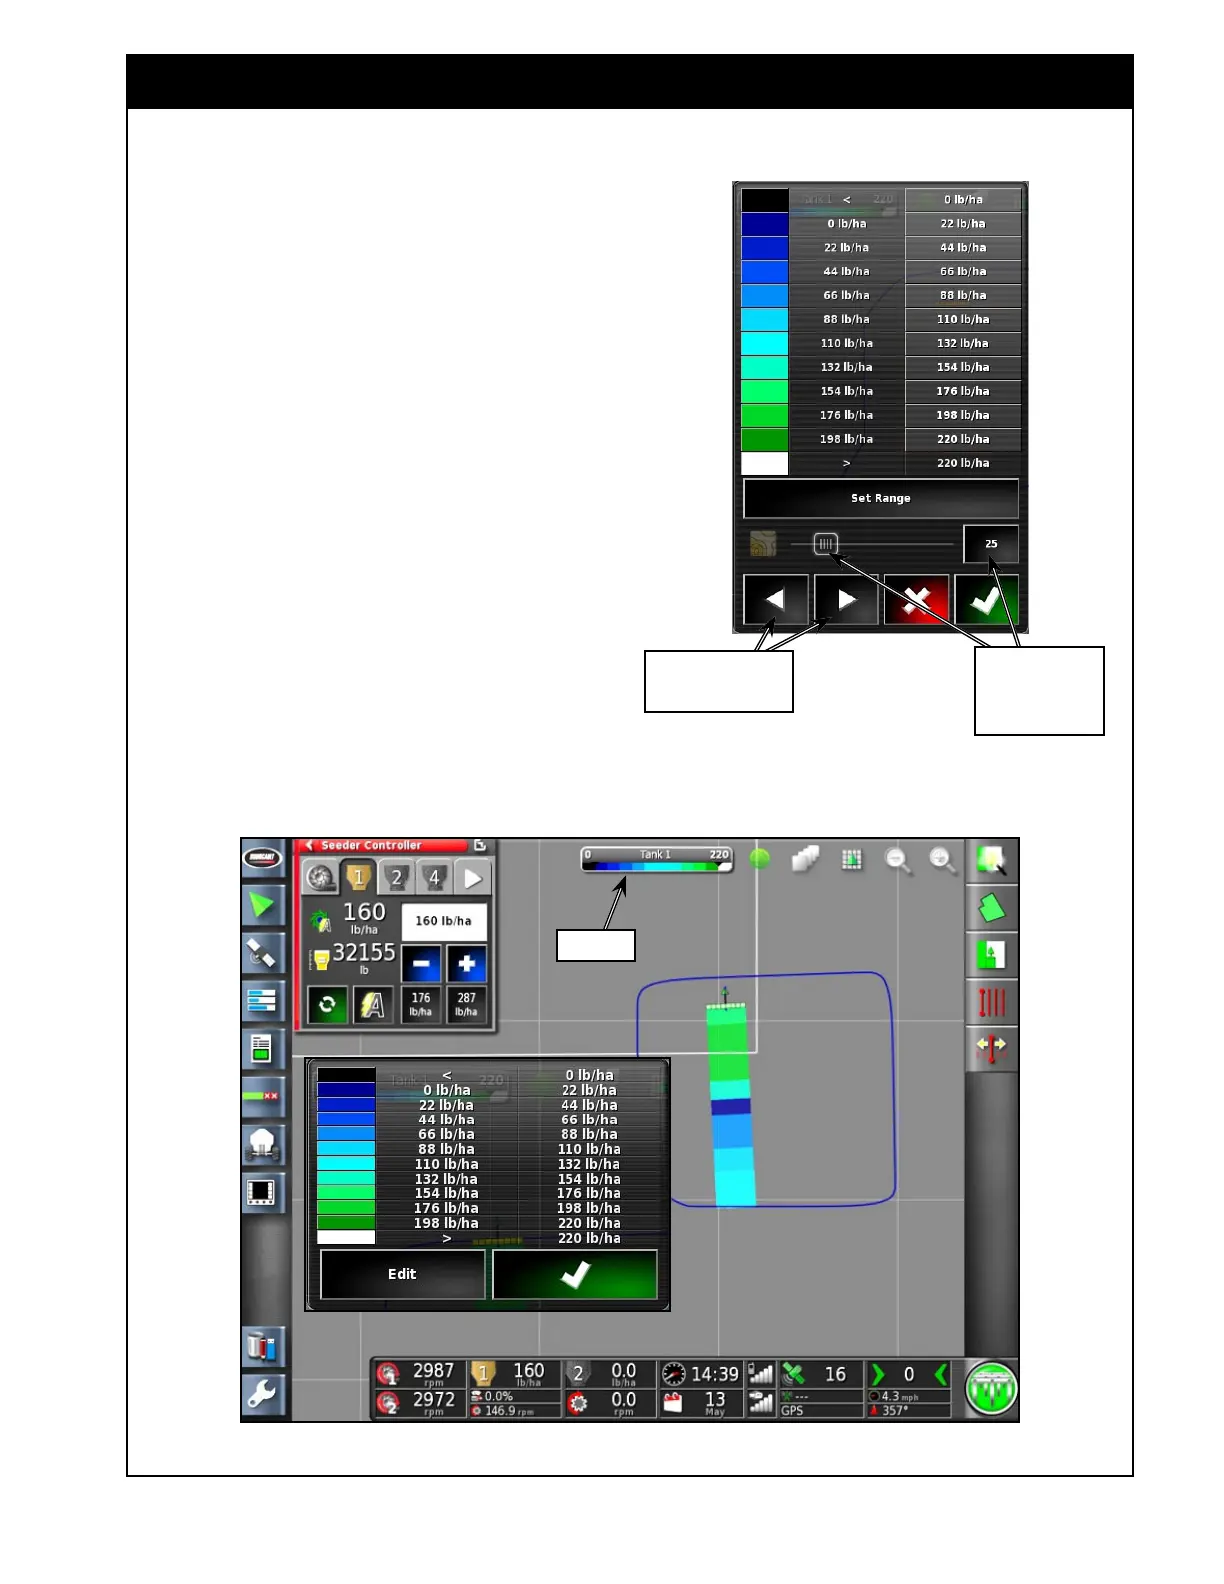
F Applied Rate Map Legend - shows the range
of product rate values indicated by the colour
intensity or different colour scheme. Refer to
Figure 2.16.
i. Selecting the legend will bring up
a window showing rates range and
corresponding colours, that can be edited,
refer to
Figure 2.16.
ii. Selecting the "Edit" button will open up
the edit window. Refer to
Figure 2.15.
a. Using Up/Down arrows you can
switch between different colour
schemes.
b. Selecting Set Range will allow to
set the range by entering minimum
and maximum values, and number of
ranges between 1-10.
c. Selecting Auto Applied will display
the range based on actual applied
minimum and maximum rates.
iii. You also can change background colour
intensity for prescription map.
Legend
Figure 2.16 - Applied Rate Legend
Figure 2.15 - Applied Rate Map Settings
Use this buttons to
change colour scheme
Use this slide bar
or button to set
background colour
intensity
 Loading...