CELL-DYN 3000 System Operator’s Manual 10-9
9140240E — May 1995
Chapter 10 Troubleshooting
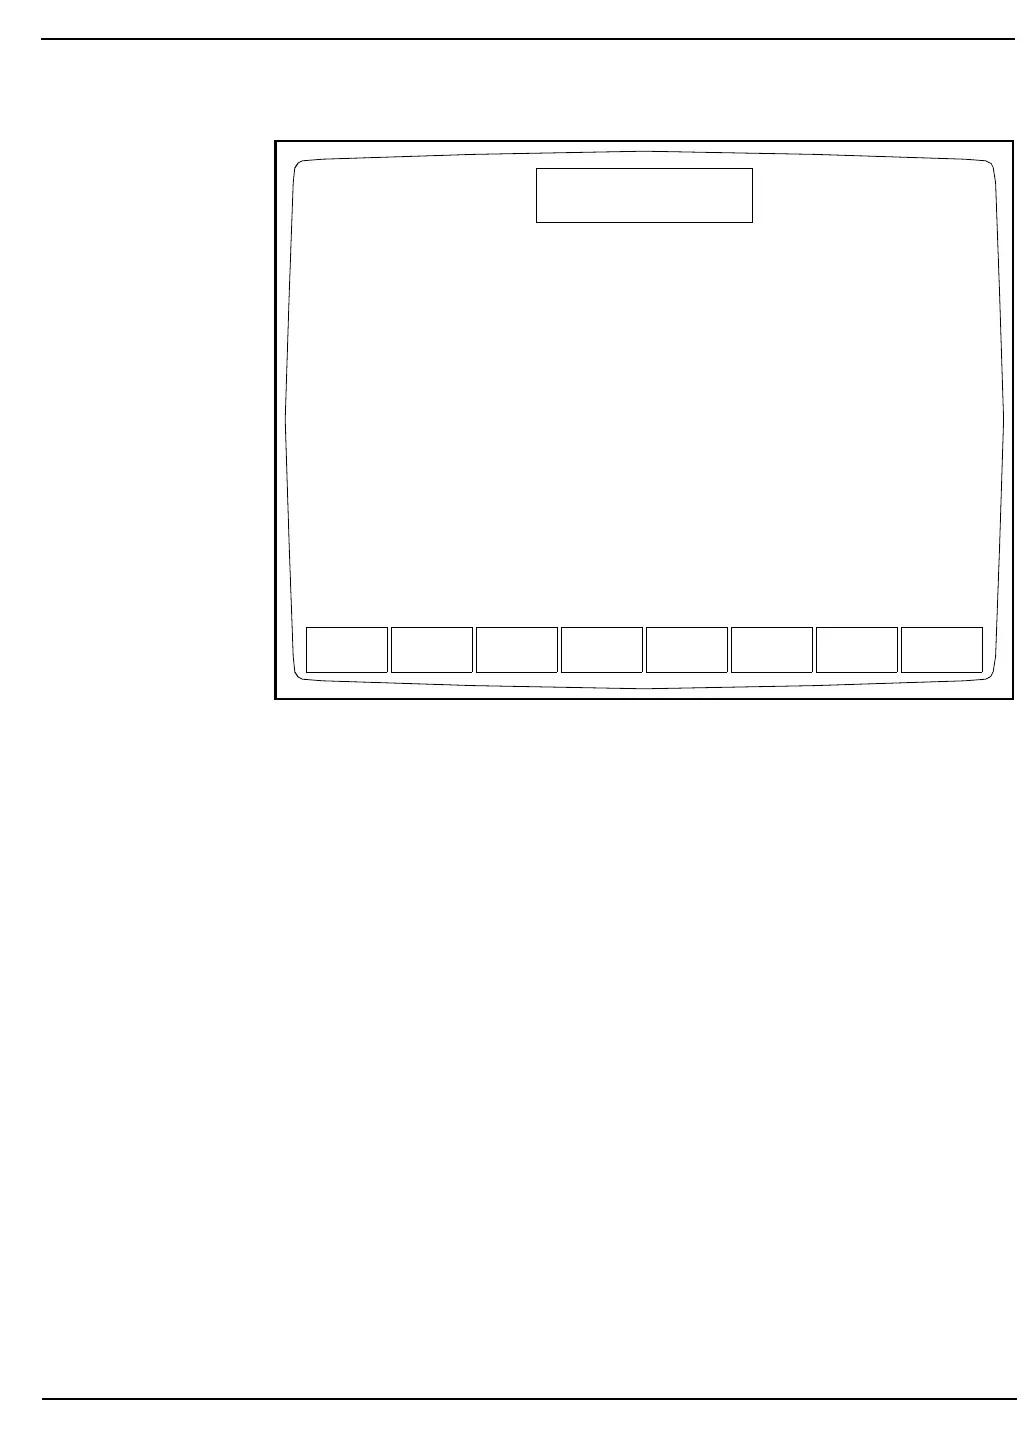
Figure 10.6: WBC Count Rate Data
Count rate data from the last cycle is displayed in a tabular format. The
total count, time segments and rate per second are displayed for multiple
data points from that cycle. (See Figure 10.6.) When the [RATE
GRAPH] key for a particular parameter is pressed, the rate-per-second
data is displayed as a graph. (See Figure 10.7.) The kinetic data and
graph are useful when troubleshooting problems related to these
parameters.
WBC
RATE GRAPH
RBC
CNT RATE
PLT
CNT RATE
PRINT RETURN
DIAGNOSTICS MENU
Ready
Jan 20 1993
Operator ID
Sequence #
12:30
734
2716
Max % diff WBC:18 RBC:7 PLT:45
WBC : TOTAL COUNT: 5934
TIME: 0.50 1.05 1.55 2.07 2.57 3.08 3.62 4.12
COUNT: 361 808 1183 1576 1989 2359 2799 3225
RATE: 714.85 827.78 742.57 755.77 826.00 725.49 822.43 843.56
TIME: 4.63 5.14 5.67 6.21 6.73 7.24 7.50
COUNT: 3666 4074 4500 4924 5342 5743 5934
RATE: 864.71 800.00 811.43 777.98 803.85 794.06 720.75