4-26 Chapter 4
Start Troubleshooting Here
Troubleshooting 8753ES Option 014
Symptom Example Plots
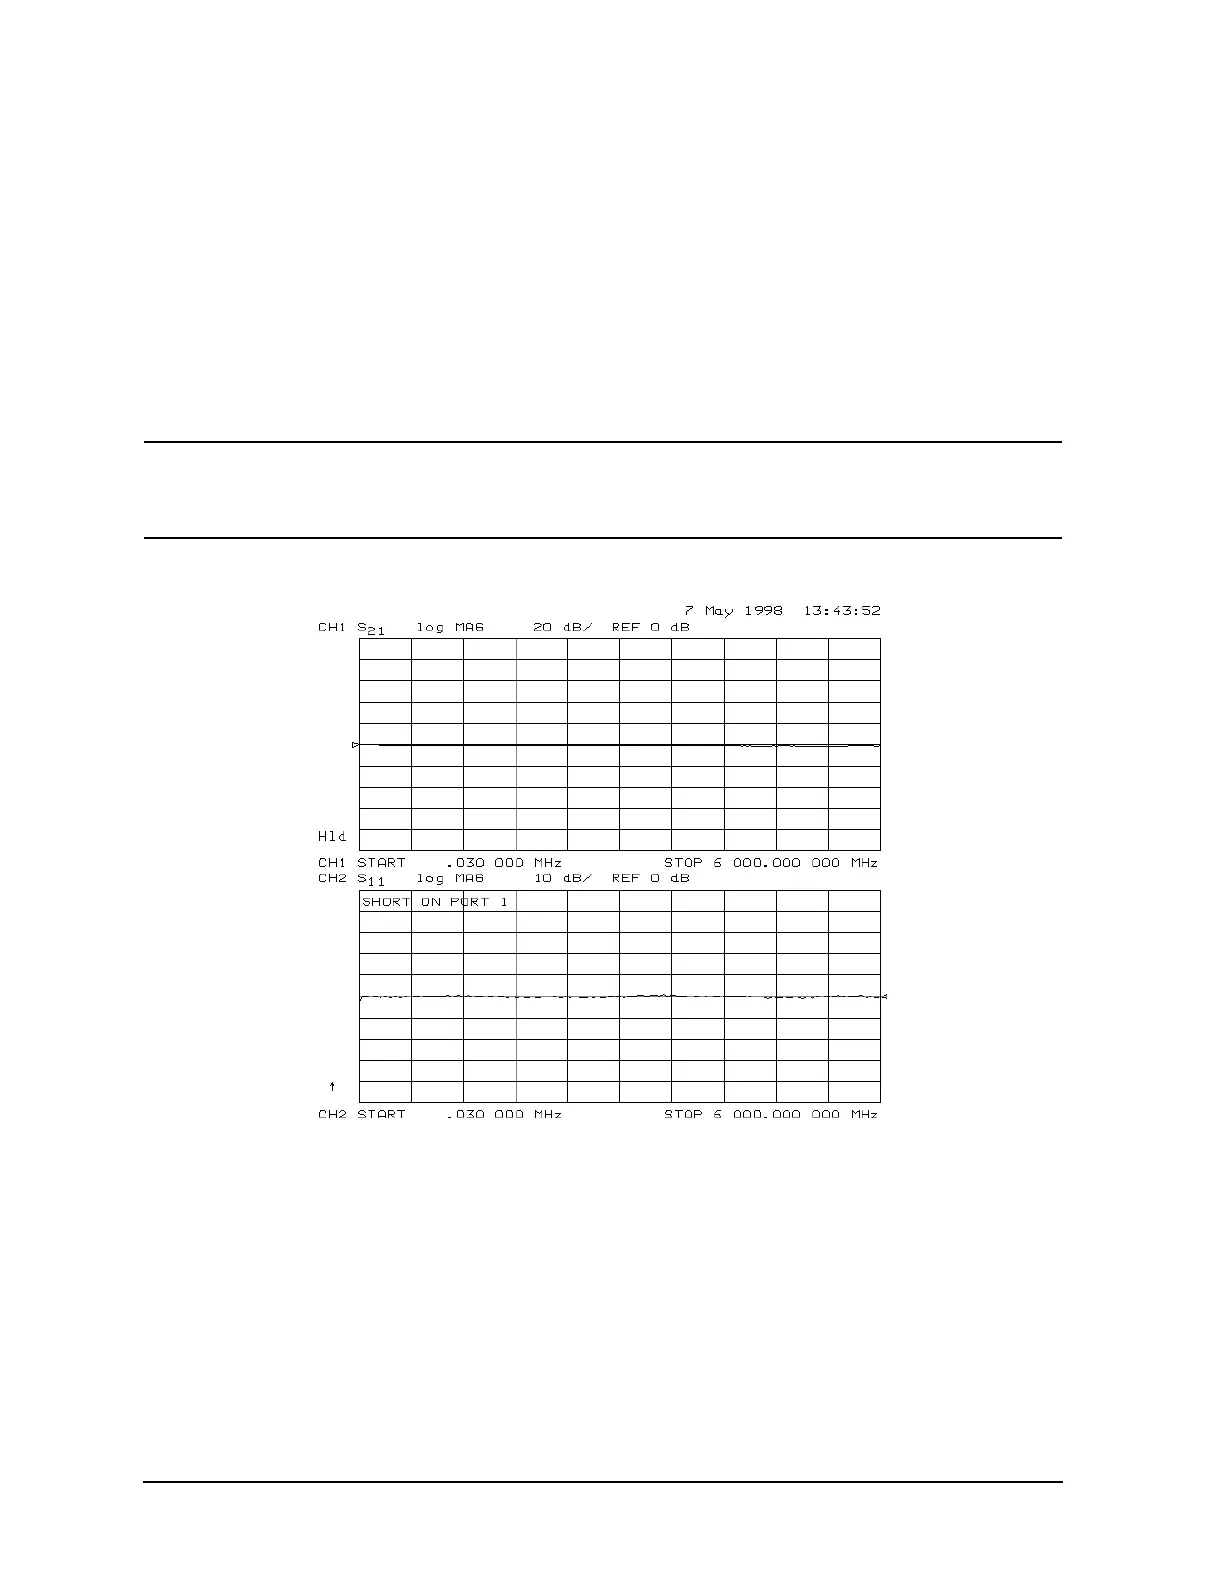
The following are examples of S21, S12, S11 and S22 measurements. Figure 4-13,
“Example of a Good Measurement,” shows what good S21 and S11 measurements would
look like. (These are only examples. The signal that you see may vary with your
instrument.) Figure 4-14, “Example of a Power Hole,” and Figure 4-15, “Example of
Frequency Roll Off,” are examples of what an irregular or a degraded signal might look
like. These plots are intended to be used only as examples for troubleshooting. Symptoms
one through four include sample plots of what irregular or degraded signals may look like
for the different S-parameter measurements described in the symptom.
CAUTION If problems are experienced and replacement parts are required, refer to
Chapter 13 , “Replaceable Parts.” It is recommended that all service be done
by qualified Agilent Technologies service personnel.
Figure 4-13 Example of a Good Measurement

 Loading...


