Chapter 2 2-33
System Verification and Performance Tests
Agilent 8753ES System Verification and Performance Tests
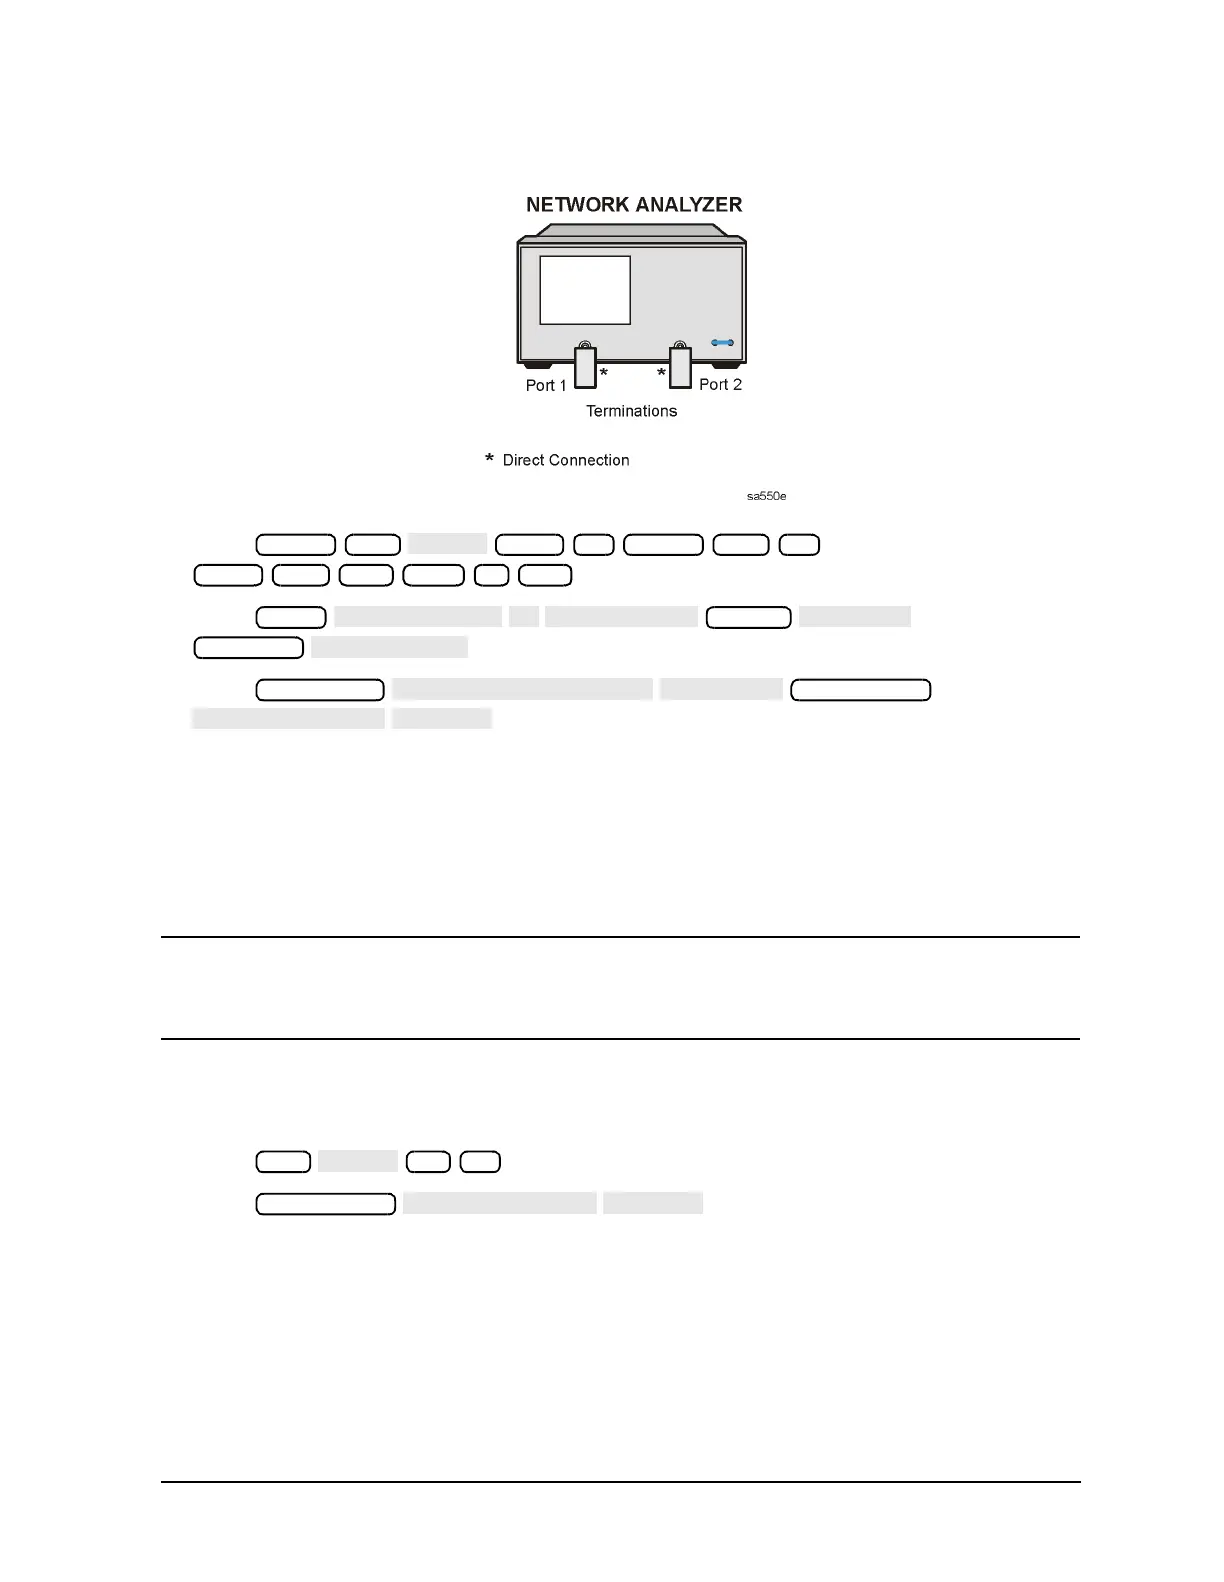
Figure 2-17 Source Input Noise Floor Test Setup
2. Press
.
3. Press
.
4. Press
.
5. When the analyzer finishes the sweep, notice the mean value (which appears on the
analyzer display).
6. Convert the measured linear magnitude mean value to log magnitude, using this
equation.
Power (dBm) = 20 × [log
10
(linear magnitude mean value)]
NOTE Notice that the mean value that is displayed on the analyzer is in µU units.
So, for example, if the displayed value is 62 µU, the value that you would put
in the equation is (62 × 10
−
6
).
7. Write this calculated value on the performance test record.
Test Port 1 Noise Floor Level from 300 kHz to 3 GHz (IF BW = 10 Hz)
8. Press to change the IF bandwidth to 10 Hz.
9. Press .
10.When the analyzer finishes the sweep, notice the mean value.
11.Convert the measured linear magnitude mean value to log magnitude, using this
equation.
Power (dBm) = 20 × [log
10
(linear magnitude mean value)]
12.Write this calculated value on the performance test record.
Preset Avg
x1 Power −85 x1
Start 300 k/m Stop 3
Meas
Format
Scale Ref
Marker Fctn
Sweep Setup
Avg
10 x1

 Loading...


