SPO2 MONITORING SETTINGS
VF6 Infinity Vista 12-11
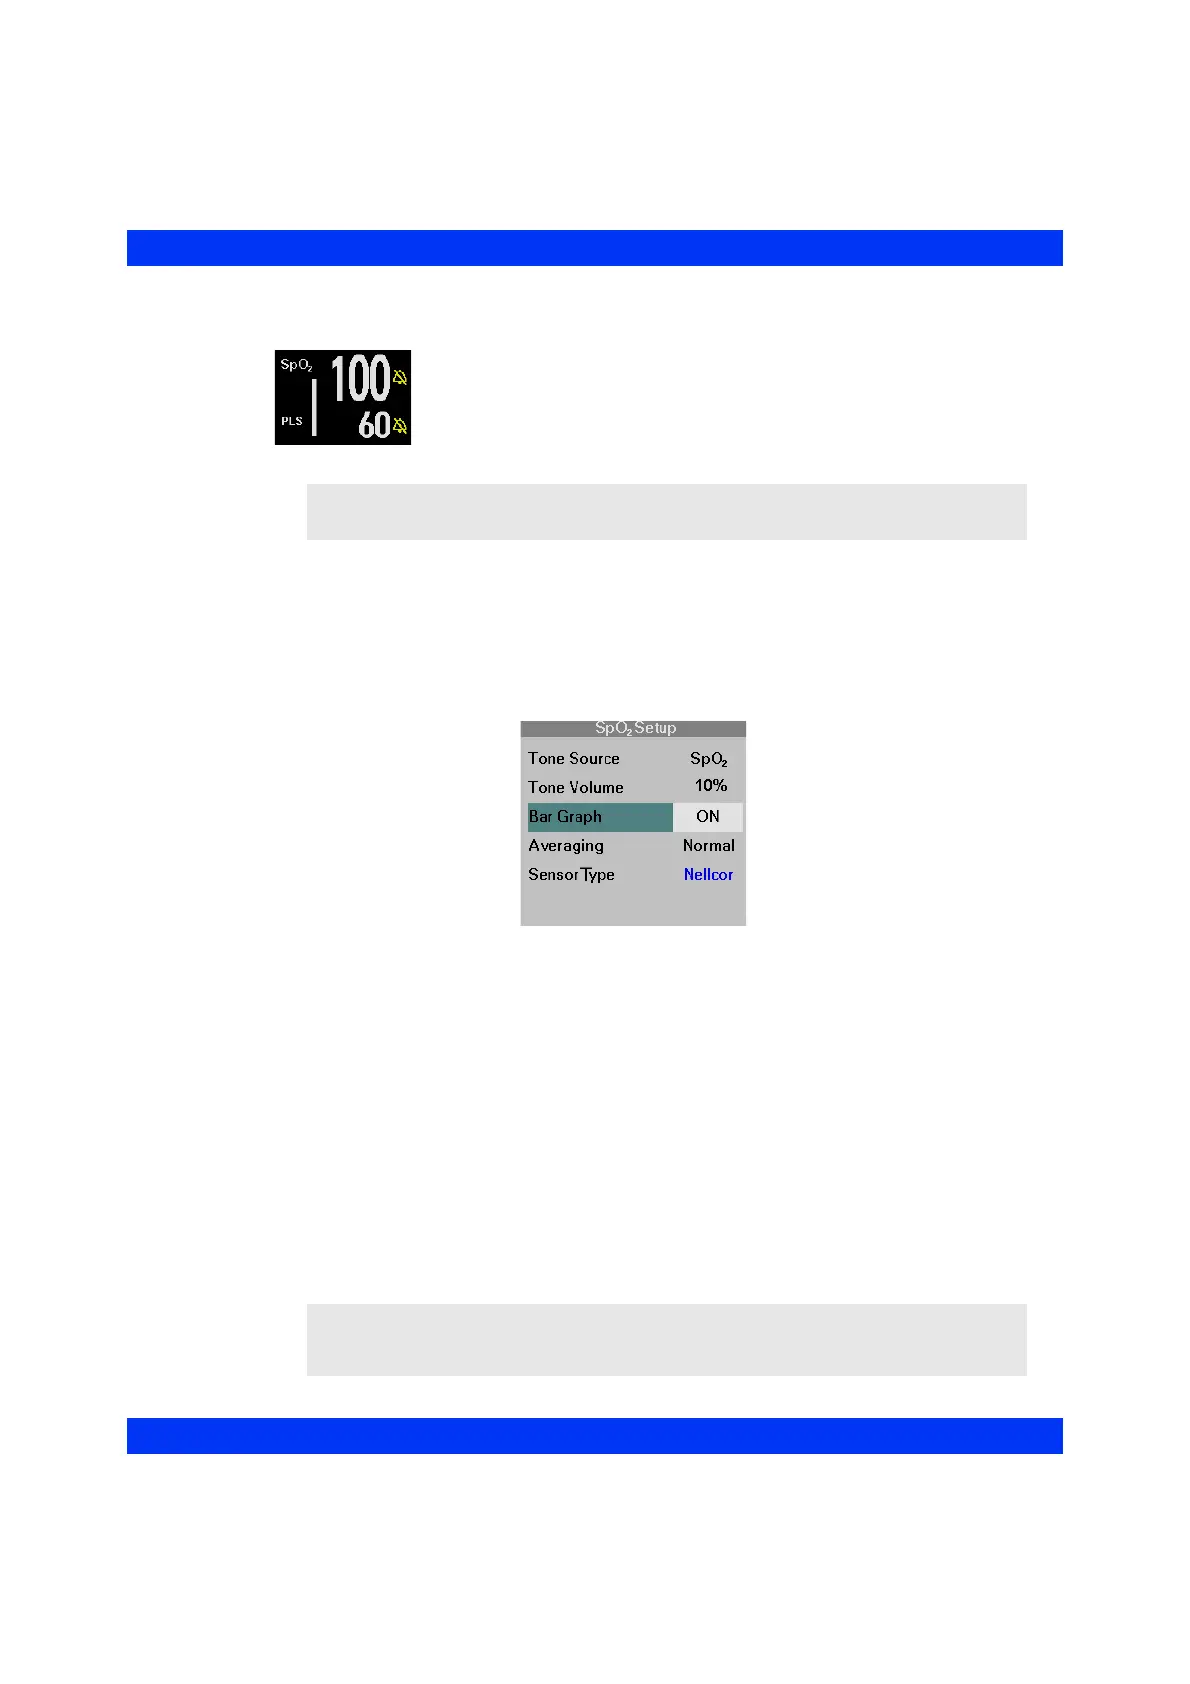
Signal Strength Bar Graph
The monitor can display a pulsing bar graph. The number of
illuminated segments is proportional to the pulse amplitude. Proper
sensor placement and environmental conditions ensure a strong
signal. Refer to the section Sensor Application for details.
STEPS: Displaying the Signal Strength Bar Graph
1. Click on the SpO2 parameter box.
2. Click on
Bar Graph.
3. Select
ON or OFF and click the knob.
Averaging Mode
The monitor calculates the oxygen saturation of the arterial blood and the derived
pulse rate based on the averaging mode you select in the SpO
2
menu. The two modes
are Normal and Fast.
z The Normal averaging mode updates the SpO
2
value and the derived pulse
rate in 30 seconds or less (8 seconds or less with the Masimo SET pod).
z The Fast averaging mode updates the SpO
2
value and the derived pulse rate in
12 seconds or less (2 to 4 seconds with the Masimo SET pod).
Response time may improve as pulse rate increases.
NOTE: The SpO
2
waveform and bar graph are auto-scaled by the Masimo SpO
2
pod.
NOTE: When monitoring most patients, Dräger recommends using the Normal
averaging mode. The Fast mode is designed for neonatal patients when fast reporting of
oxygen desaturation is important.