TREND G RAPHS
VF6 Infinity Vista 6-3
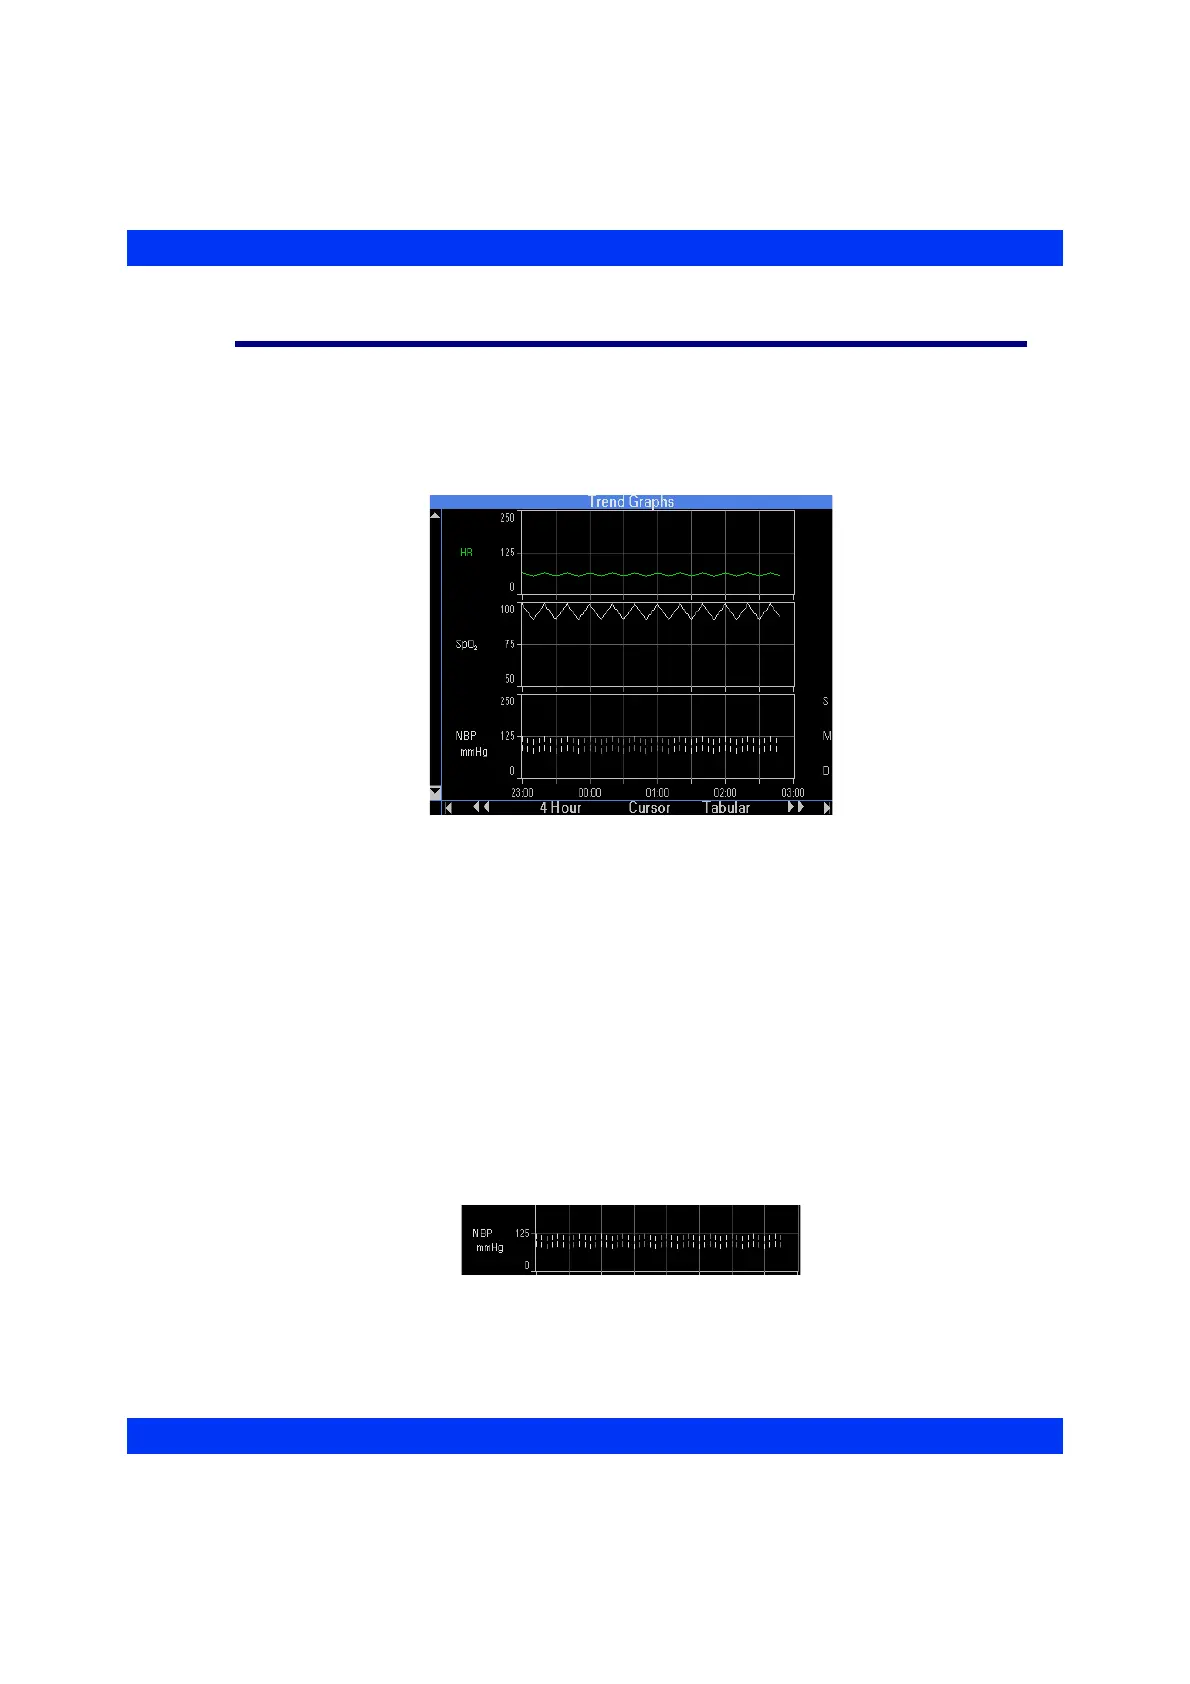
Trend Graphs
Trend Graphs display up to 12 hours of trended data at a time, sampled and updated
every minute. When you first access the graphical trend screen, the monitor shows the
most recent trend values plotted against a time grid along the horizontal axis of the
graph.
The monitor identifies parameters by their color on the graph (labels and waveforms).
When you click on the trend cursor (see below) trend values appear to the right of the
graph in white or in the color of the alarm grade, if the parameter was in alarm during
the one-minute trend sampling interval.
Each trended parameter has a scaled vertical axis to the left of the trend display
channel. Values that fall outside the trend scale are plotted at the maximum or
minimum of that scale. To see these values, move the cursor to the plotted line and
read the values on the graph.
Pressure trend graphs (NBP, GP1, GP2) show small vertical segments: a top segment
for the systolic pressure, a bottom segment for the diastolic pressure, and a blank
segment in between, representing the mean pressure. Mean only values are plotted as
single curves.