GASLAB Q2 DISPLAYS (OPERATE THE DEVICE)
Information for general use
Rev. M / 73023639
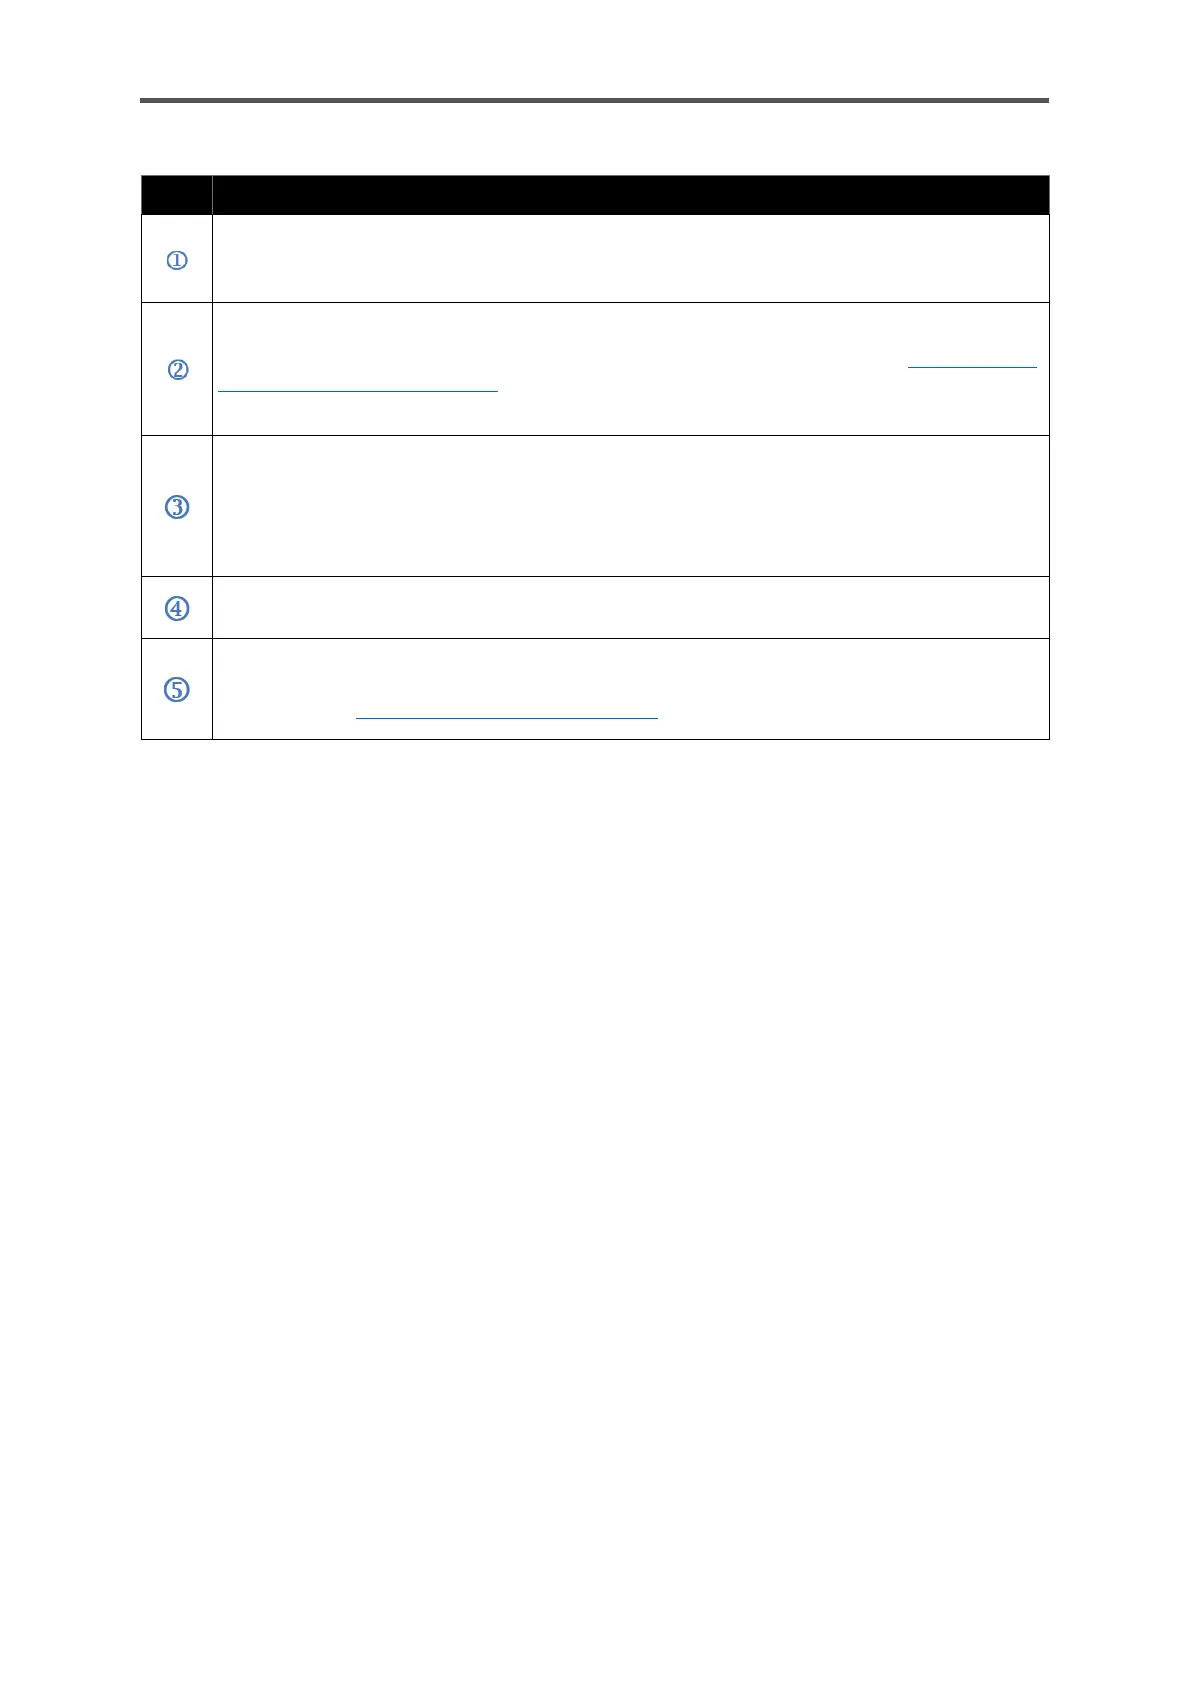
Filter selection box: In the first line, you can use the drop-down list to restrict the display
to the selected range.
Action Accept all: All displayed errors which are no longer current can be accepted at the
same time so that they are no longer displayed. They must comply with the Configuration
and analysis software enSuite defined acceptance action for this purpose. Messages
which are still active or have been filtered out will be retained.
Section of the error display: The date and time of the start of the error are displayed on the
left and the end of the error on the right (if applicable), with the relevant message beneath.
If the list contains more than 2 events, you can scroll through it (yellow diamond on the
right-hand edge).
Action Refresh: the error list which was “frozen” when it was opened, will be updated.
Link to go to the logbook: you can go to the “Logbook error list”
See section 7.3.12 System display (Logbook)
The error list is sorted in chronological order with the latest message being displayed first. If there
are more messages than can be displayed at once, the scroll bar appears at the right edge. If only a
few faults are contained in the overall list, scroll down to see individual messages. If the list is longer,
you can filter the contents according to the message origin by selecting the software part, e.g. "Time
service", from the Filter selection list. Only the corresponding messages of this software part are
displayed.
 Loading...