8.6.5. Live data and trending function in enSuite
It is possible to view the device’s “Live data and trending” using enSuite. First of all, you must
establish a connection to the device ( see section 8.2.4 Establish a connection to the enCore
device). Once you are connected to the GasLab Q2, you can right-click on the “Live data and
trending” entry in the bottom section of the navigation window. The parameters are then read from
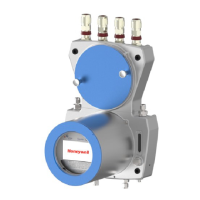
the instrument and a new window opens in the center of the screen (see figure).
Figure 8.49: Windows and tabs for “Live data and trending” function
There are 2 tabs in the window, “Dynamic charts" and “Live data”. In the “Live data” tab, you can
monitor lots of data simultaneously in number form. In the “Dynamic charts” tab, you can monitor
the data in graphic form. There are only 2 physically different data items to observe since there is a
maximum of 2 vertical axes. Several data items of the same type can be compared on each vertical
axis, for example two temperatures (in °C).
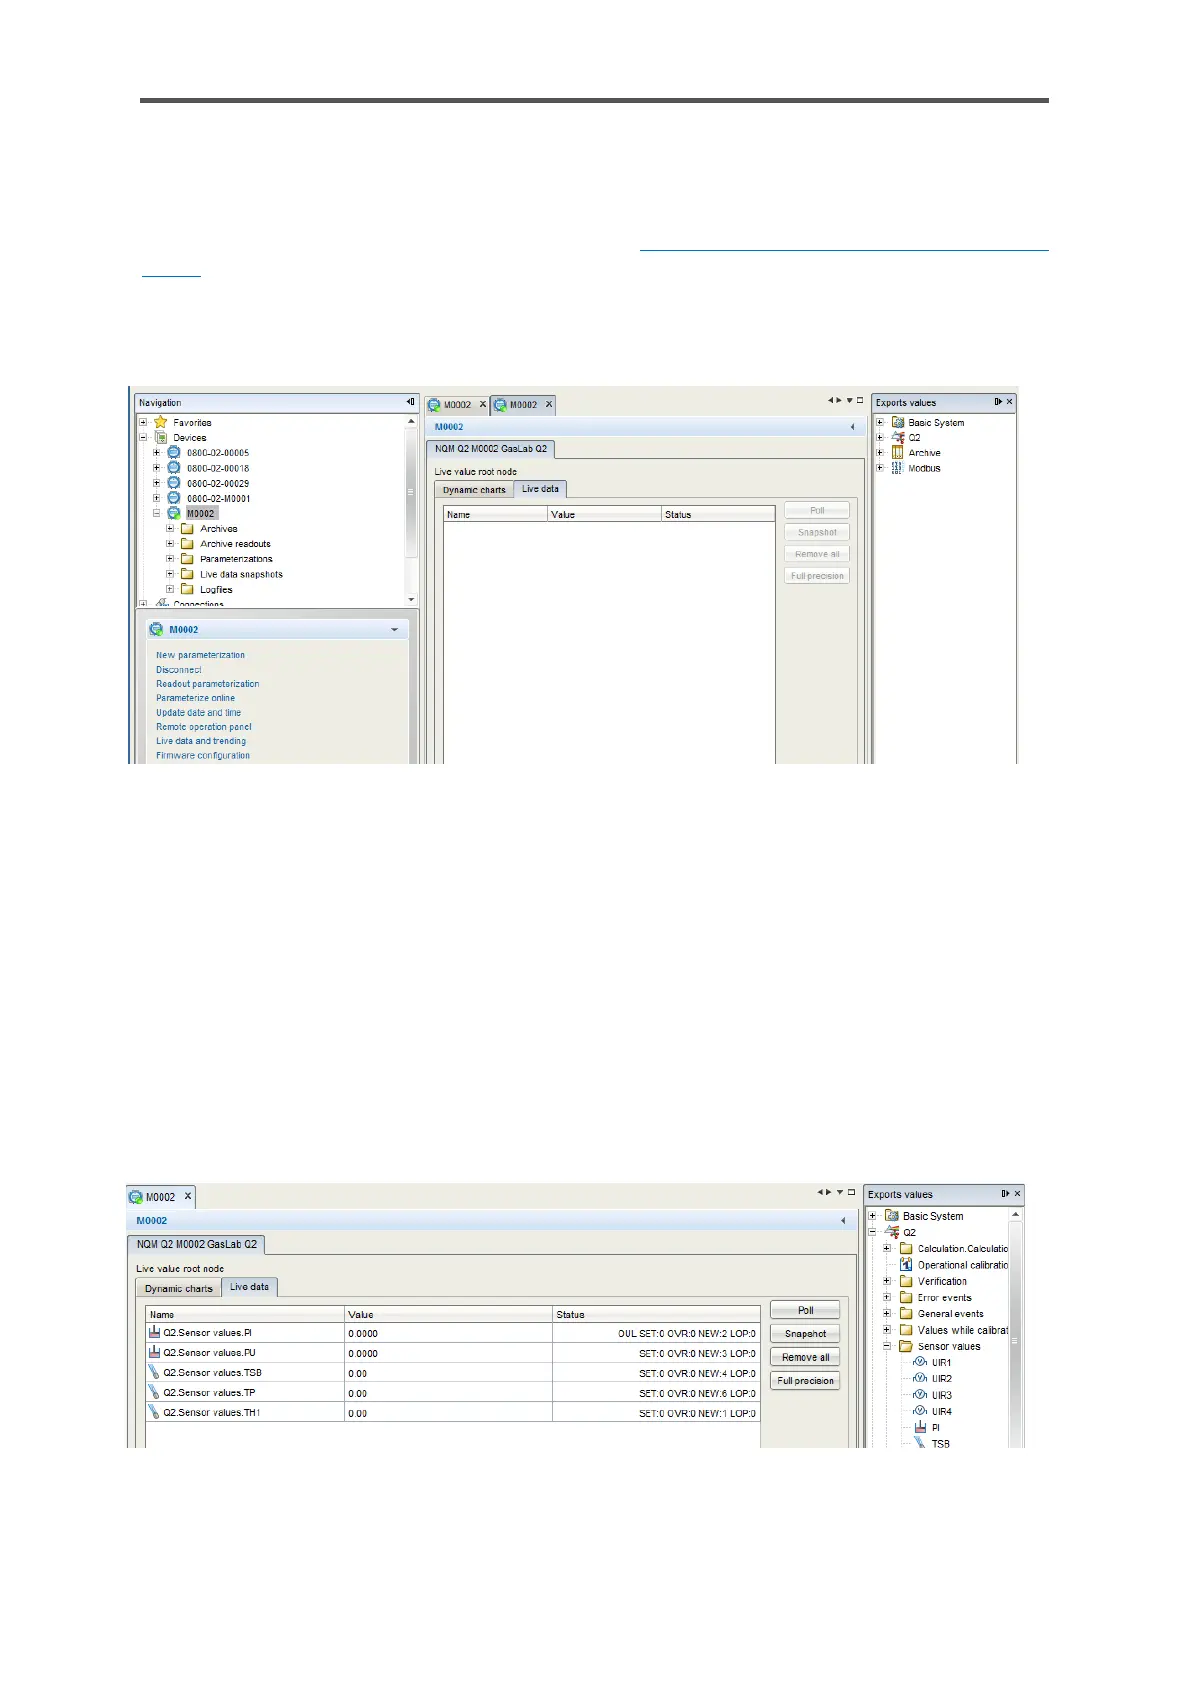
Examples of the “Live data” tab application
There is a window with all the available values in the device (parameter tree) on the right-hand side.
Simply navigate to the required value, hold it and drag it into the center window (see the following
screen section)
Figure 8.50: Live data tab
 Loading...