-500 Keysight E4980A/AL User’s Guide
Scanner Interface
Signal Input/Output Connector
-
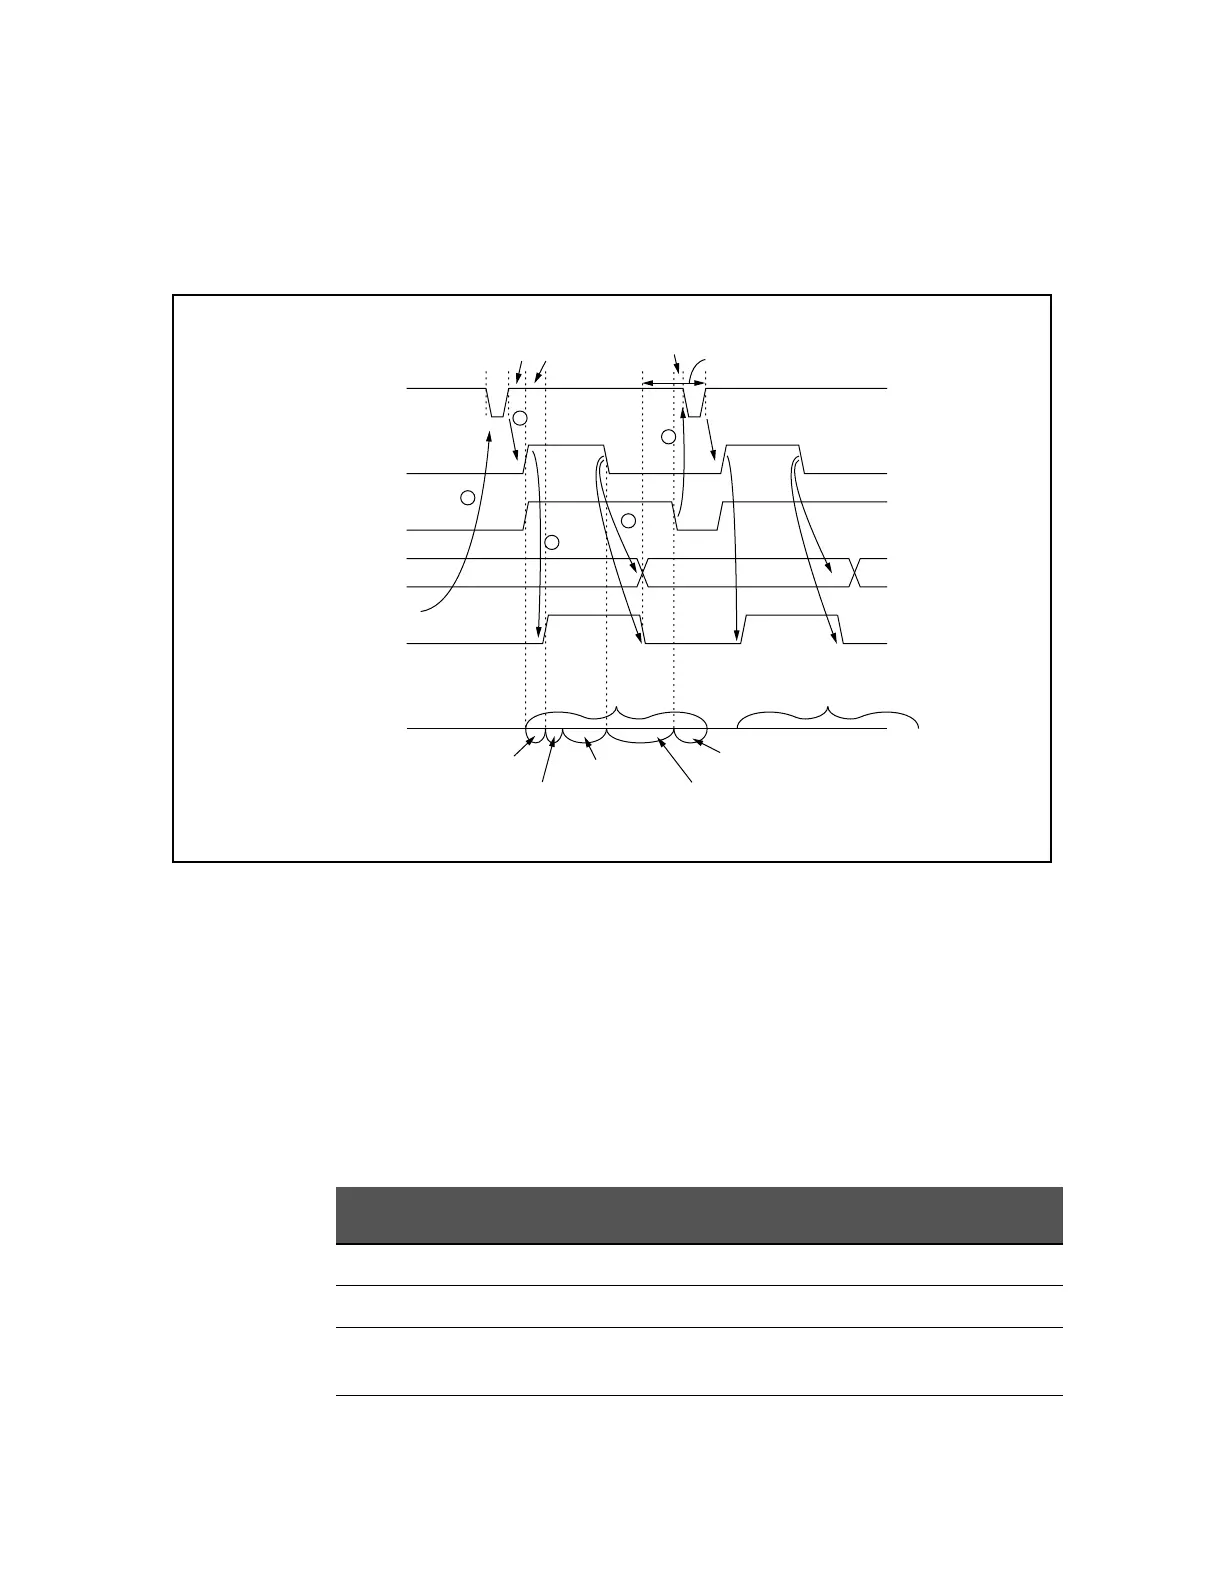
Timing Chart
The timing chart is shown in Figure F-3.
Figure F-3 Timing chart (Normal measurement)
Correction Data Switching Time 0 nsec
Measurement Time Refer to
Chapter 11, “Specifications and
Supplemental Information”, on page 417.
Comparison Time approx. 1 msec (typical)
Display Time MEAS DISPLAY page approx. 10 msec
BIN No. DISPLAY page approx. 10 msec
BIN COUNT DISPLA page approx. 10 msec
㪼㪋㪐㪏㪇㪸㫌㪼㪈㪈㪎㪇
T4
/EXT_TRIG
/INDEX
/EOM
CH No.
/CH_VALID
CH N CH N+1
Measurement
Timing
T1
T2 T3
a measurement a measurement
Correction
Data Switching
Time
Step Delay
Time
Measurement
Time
Comparison
Time
T5
Display
Time
3
2
4
5
6
Table F-8 Each time of the timing chart
Time Minimum
Typical
1
T1 Trigger Pulse Width 1 sec -
T2 Measurement Start Delay Time - 350 sec
T3 /CH_VALID Wait Time after Measurement
Start
0 nsec -
T4 Wait Time after /EOM Output 0 sec -