Millipore System Documentation Set
130 Operating and Maintenance Manual Publication XITXSP121 P Rev.A
Test Progress Graph
The test progress graph will vary depending on the type of test being conducted and the
particular test step being executed during the test sequence.
Red Line:
(See Figure 51, red line is non-bold)
The red line indicates the internal tank pressure (pressure vs. time). It only appears during the
initial test steps (Internal check, clearing the upstream, upstream gas volume sizing).
Blue Line:
(See Figure 51, Blue line is bold)
The blue line indicates the following:
1. Filter housing pressure (internal pressure of housing, capsule, cartridge, etc.)
• during the initial test steps (pressure vs. time)
2. Flow rate measurement
• gas flow during diffusion measurement (gas flow vs. time)
• water flow during HydroCorr measurement (water flow vs. time)
• during the bubble point determination (gas flow vs. pressure)
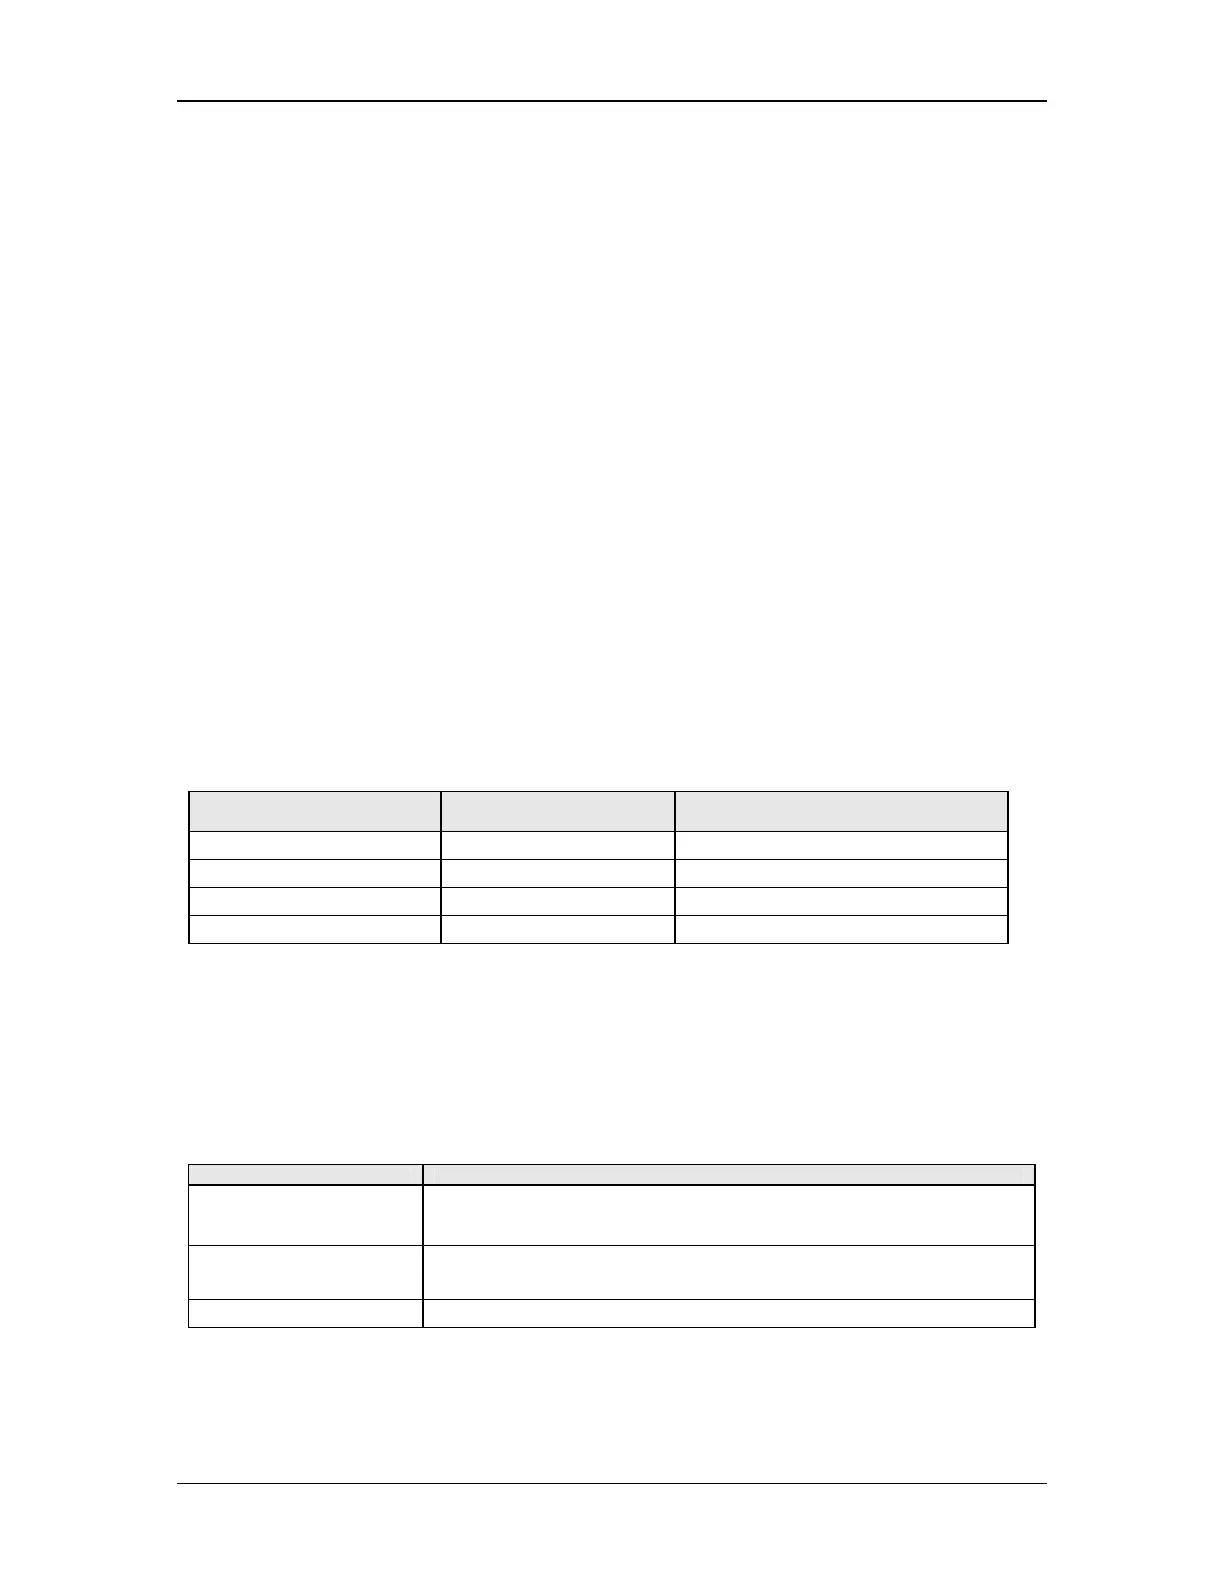
Table 12: Typical Test Times and Values Reported
Test Type Typical Test Times
(including sizing)
Value(s) Reported
Bubble Point 10–15 minutes Bubble Point
Enhanced Bubble Point 10–15 minutes Diffusion flow rate, Bubble Point
HydroCorr 20 minutes Water flow rate
Diffusion 7–10 minutes Diffusion flow rate
Test Status Box and Data Display
The message in the Status Box varies throughout the test. The messages indicate the various
stages in the test sequence as well as error conditions.
Table 13: Normal Test Cycle Status Messages
Status Message: Meaning
READY - flipped w/
unknown
May appear briefly at beginning of test while instrument is being
set up (database being read)
UNKNOWN Appears at beginning of test if there is an improper test name—
error
CHECK Verifies the hardware setup (e.g. identifying leaks)