Chapter 1 Overview
Help on Help
26 WCDMA Options Version 6.20
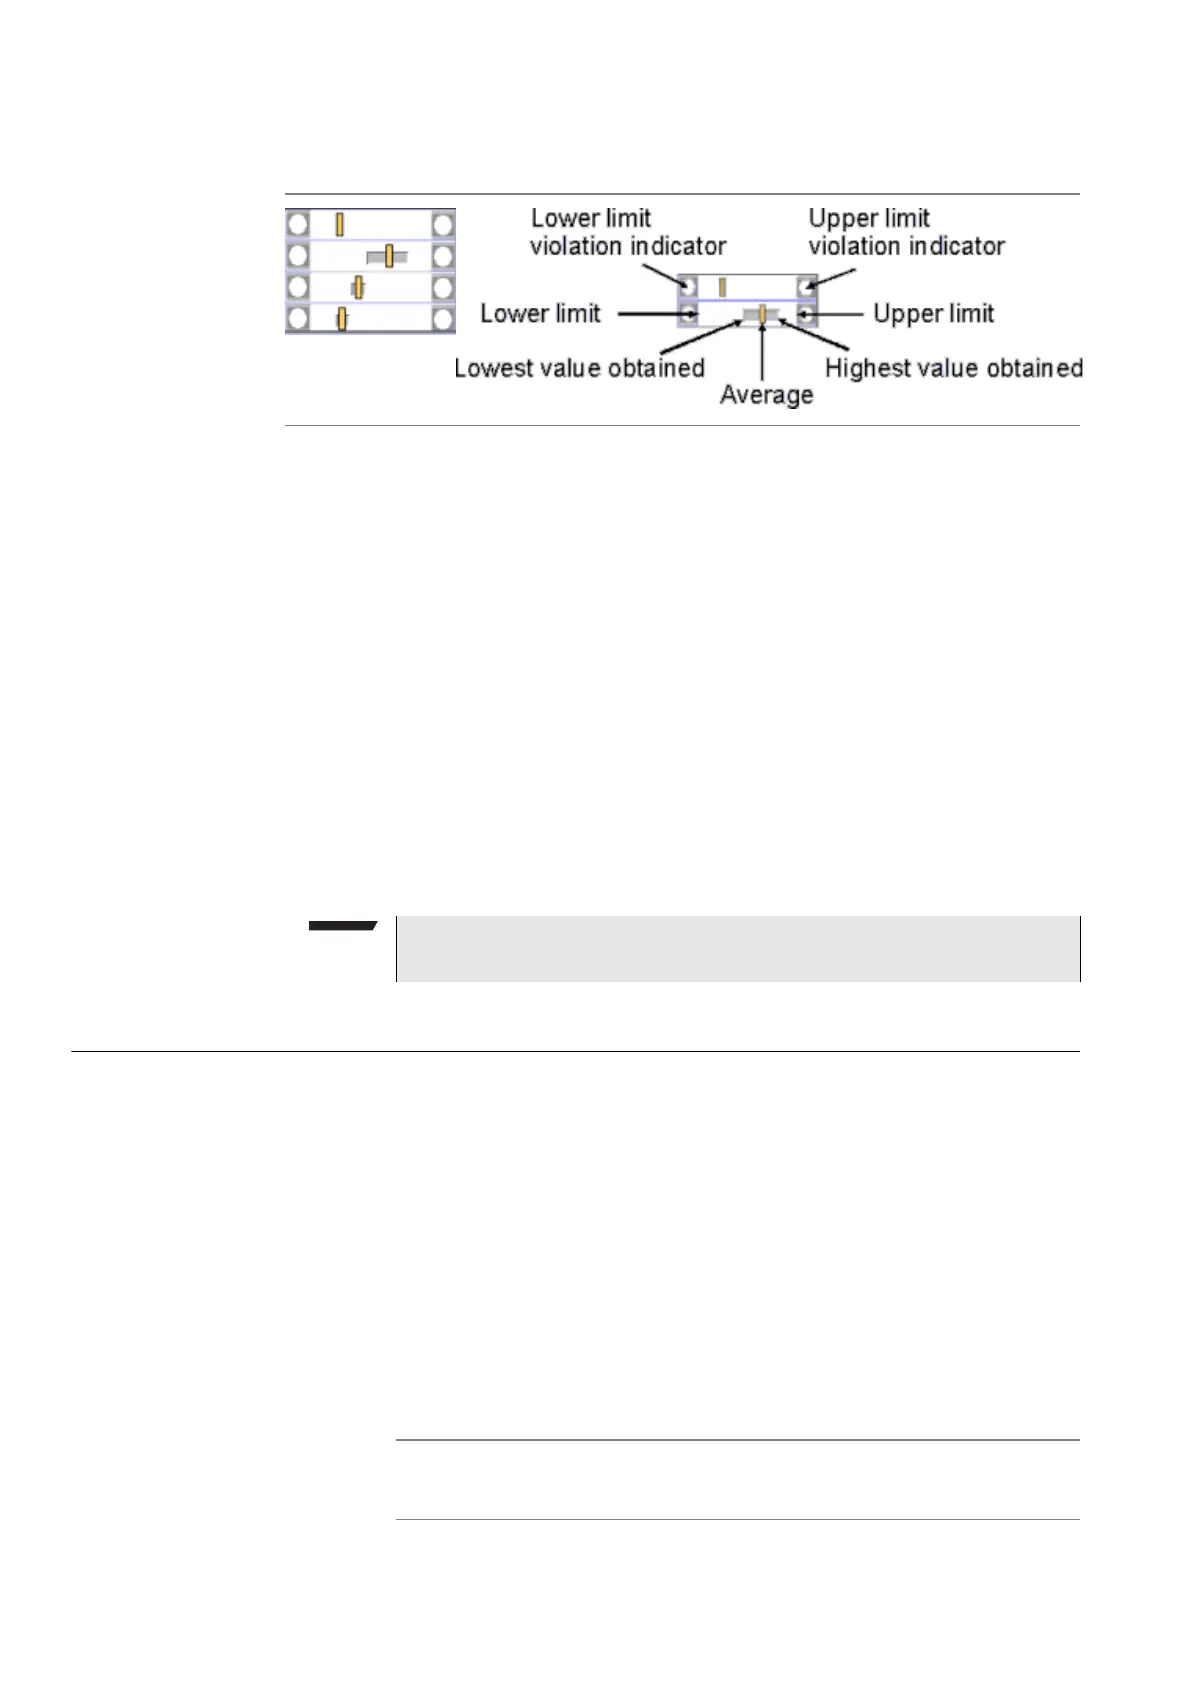
The bar display
The bar display is used to display measurement results that are obtained by
running a specific test a certain number of times. It shows a couple of important
values on a relatively small area:
–The large white area indicates the range between the lower and the upper
limit of the specific test.
–The dark gray section within the white area shows the range of all measure-
ment values obtained from the minimum to the maximum.
– The small orange rectangle marks the average value.
–The two limit violation indicators are white as long as no violations of the
test limits occur.
– As soon as a measurement value obtained is smaller than the lower limit,
the lower limit violation indicator will turn to red.
– The same will happen with the upper limit violation indicator when a
measurement value exceeds the acceptable range.
Help on Help
This section describes how to work with the Online help. Here you will find all
about
– Navigating help,
– Using the online help on an external PC.
Notation rules
While working with the Online help, you will have to push softkeys, marker tabs,
or other keys. To keep things as clear as possible, the online manual either uses
the graphical image of the item as you see it on-screen or it uses the following
notation rules:
NOTE
To reinitialize the statistics, push the
Reset softkey.
Calls & Meas.
The label of a softkey is indicated like this.
[RF Gen]
The label of a marker tab is indicated in square brackets.