CAPINTEC, INC. CAPTUS
®
600
displaying a message that reads “Data not Saved OK? (Y or N)”. If you escape by pressing
the HOME key, the data is also lost.
For measurements after the first one,
Figure 16-13 will appear after room background is
accepted:
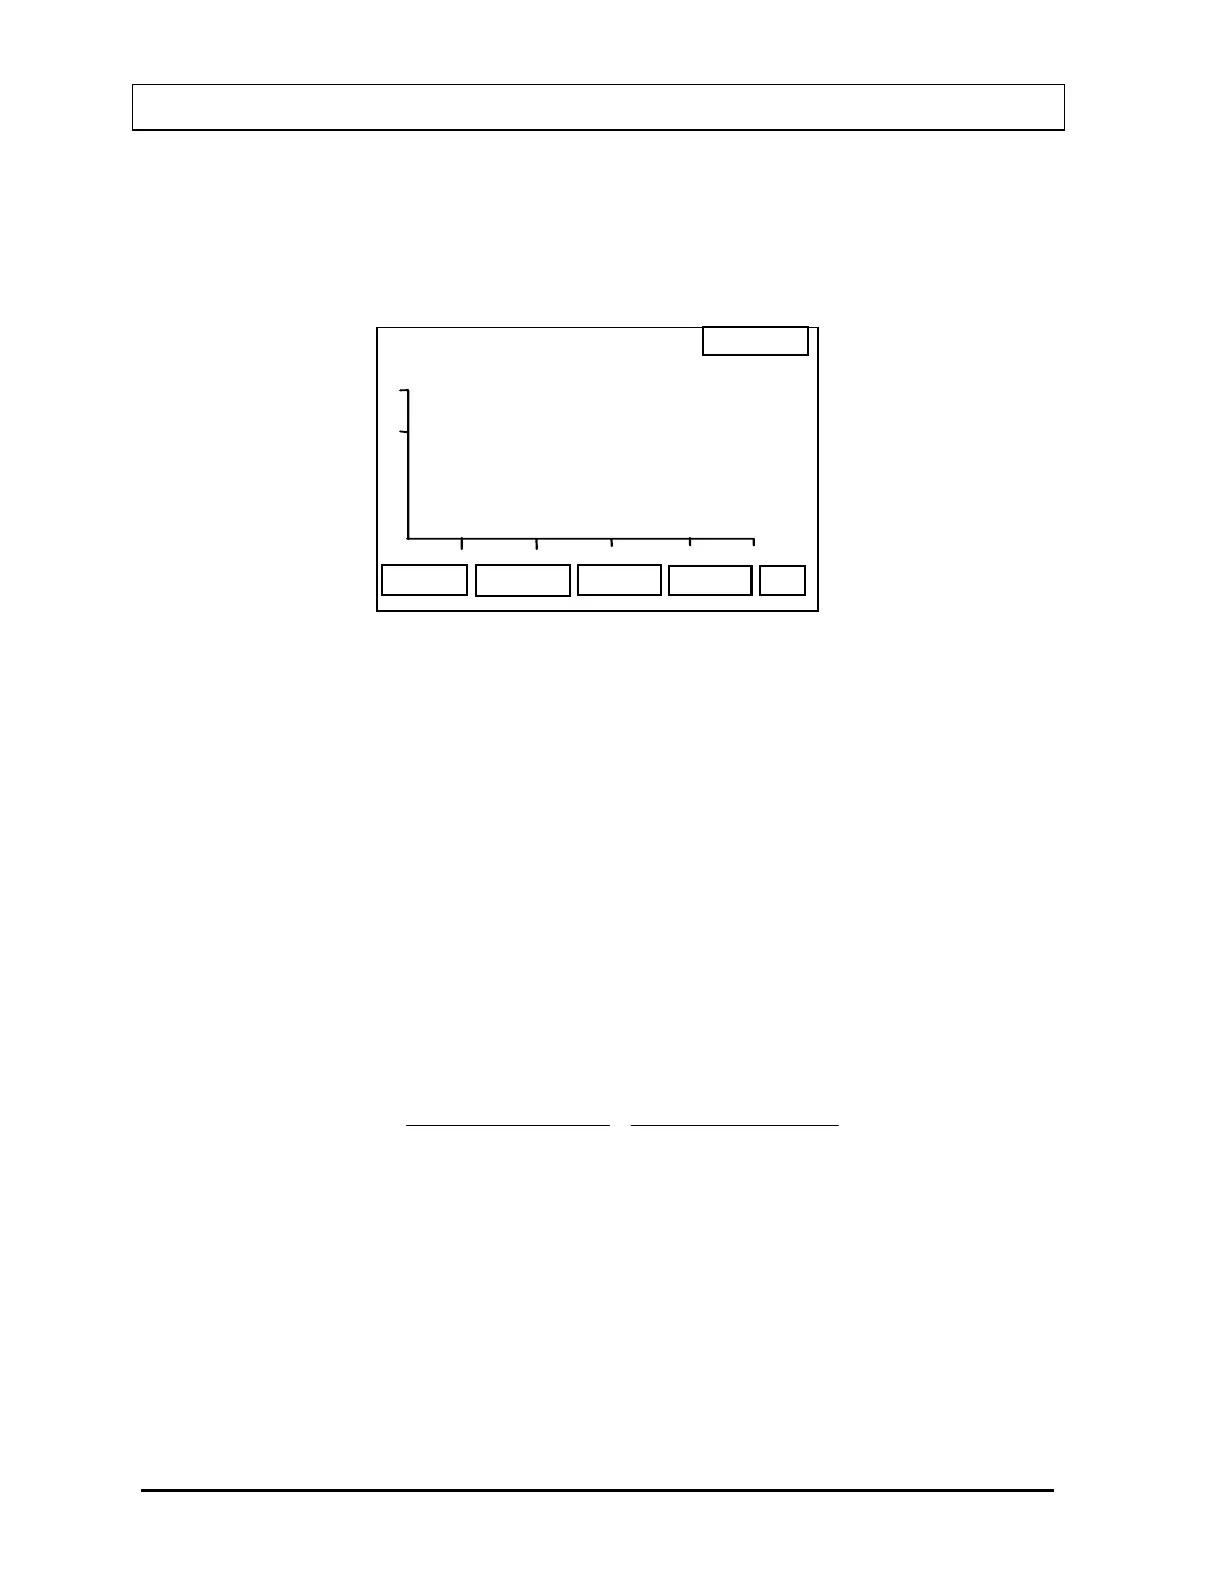
14:32
EXIT
SAVE
RBC SURVIVAL
PATIENT , ONE
P
Days
10
20
30 40 50
50
100
x
x
x
x
Figure 16-13
This shows a graph of the data with percent remaining on the Y-axis and days since injection
on the X-axis. The axis scales are fixed and data values outside the range of the graph will
not be plotted but will appear on the print out.
When 4 or more measurements have been made, the best-fit straight line through the data
points will be calculated and displayed on the graph. In addition, the 50% survival rate will be
calculated from the best fit.
At this point the data for each measurement must be saved in order to be included in the
report otherwise it will be lost.
For a report of detailed data press the PRINT [P] key. A sample printout is shown in
Figure
16-14
.
Percent Remaining (% LEFT on the print out) is calculated as follows:
100
(sample) Hematocrit
100%)(at Hematocrit
100%)(at CPM NET
(sample) CPM NET
= LEFT % ××
16-12 LAB TESTS: BLOOD TESTS November 07