EasyManua.ls Logo

Cleverscope CS300 - Matlab Functions - Example 2; Matlab Functions - Example 3

Default Icon
188 pages
Print Icon
To Next Page IconTo Next Page
To Previous Page IconTo Previous Page
Loading...
v2.13 Cleverscope CS300 Reference Manual
©Cleverscope 2004-2018 www.cleverscope.com Page 137
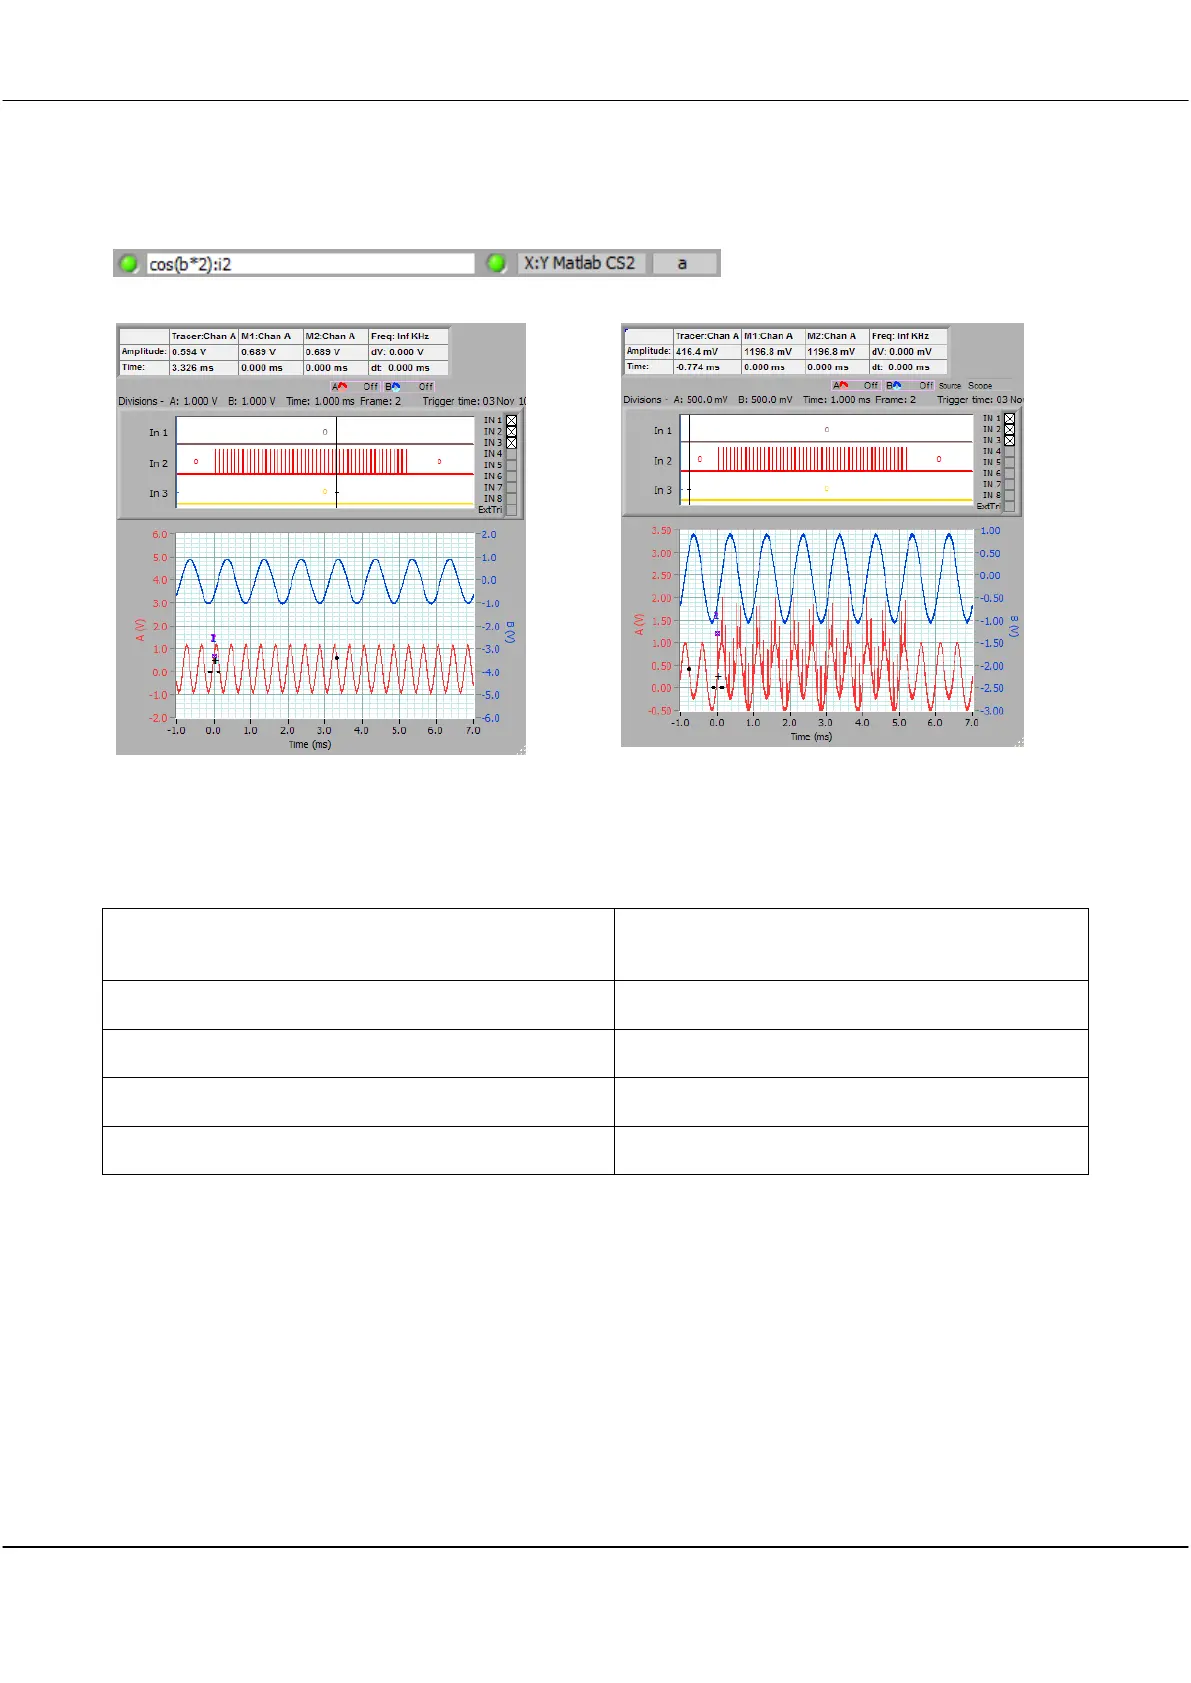
20.4 Matlab Functions - Example 2
Input Signal
Maths Display result
20.5 Matlab Functions - Example 3
Cscope1.m adds two channels together, returns result, and plots a and y in red and blue in a Matlab Figure.
function z =
cscope(x,y,n,T0,dt,TrigSecs,TrigPartSecs,Frame)
z = x + y
time=((0:n-1)*dt)+T0
% Calc graph time axis
figure (1)
% Plot data to fig 1
plot(time, x, 'r', time, y, 'b')
%plot the data grid on

Table of Contents