v2.13 Cleverscope CS300 Reference Manual
©Cleverscope 2004-2018 www.cleverscope.com Page 139
20.7 Using Matlab for Further Processing
We have cscope4.m defined as:
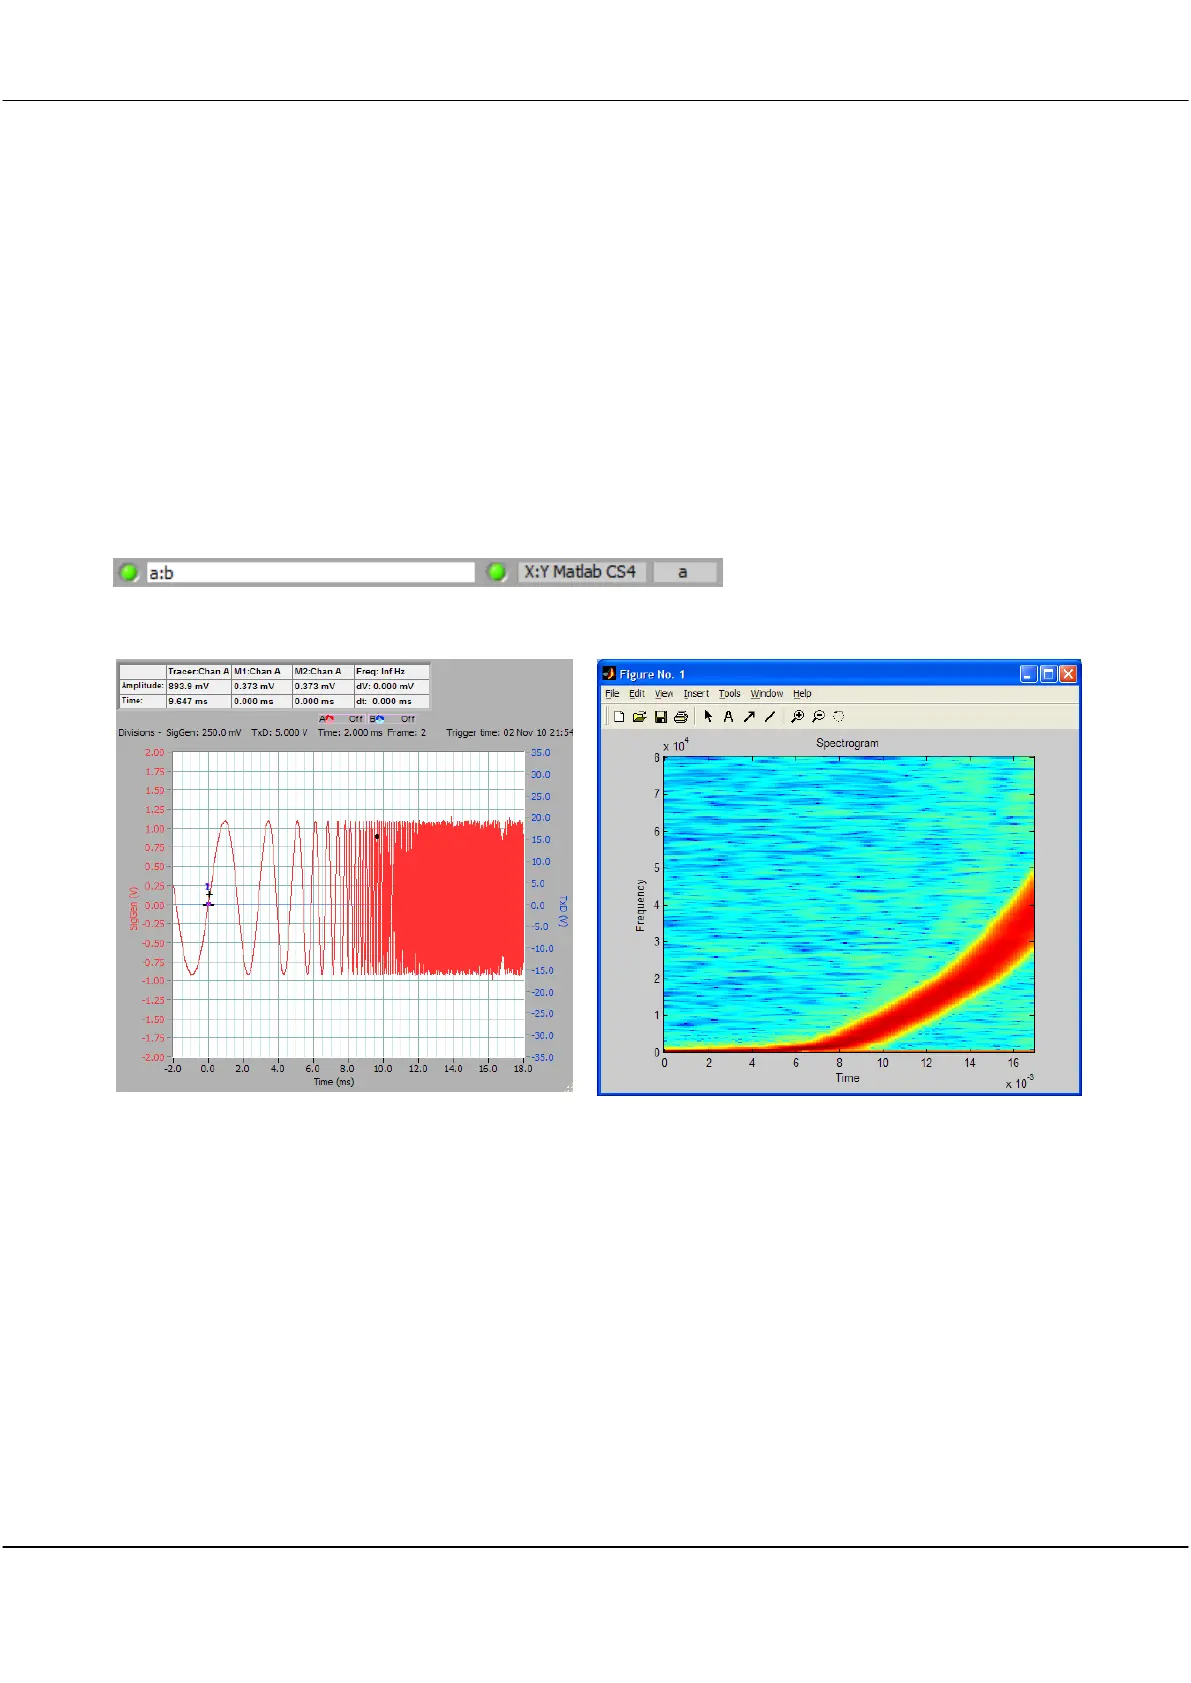
Cscope4.m – plots the spectrogram of channel a
function z = cscope(x,y,n,T0,dt,TrigSecs,TrigPartSecs,Frame)
z = x
specgram(x,512,1/dt,500,475)
Input Signal – Frequency Chirp
20.8 Conclusion
With up to four processes to call Matlab with, and fully flexibility on the data sent to Matlab, you have a great
deal of scope in using Matlab to extend the already high Cleverscope functionality.