v2.13 Cleverscope CS300 Reference Manual
©Cleverscope 2004-2018 www.cleverscope.com Page 63
Note When selecting a reduced frequency span you need to be aware of aliasing. Reducing the frequency span
essentially samples the signal at a lower rate. If frequency components above half the effective sample rate are
present, these will alias (or fold) back into the displayed spectra.
Refer to Settings/Spectrum Menu.
The Spectrum Dialog is used to control aspects of the Spectrum Display.
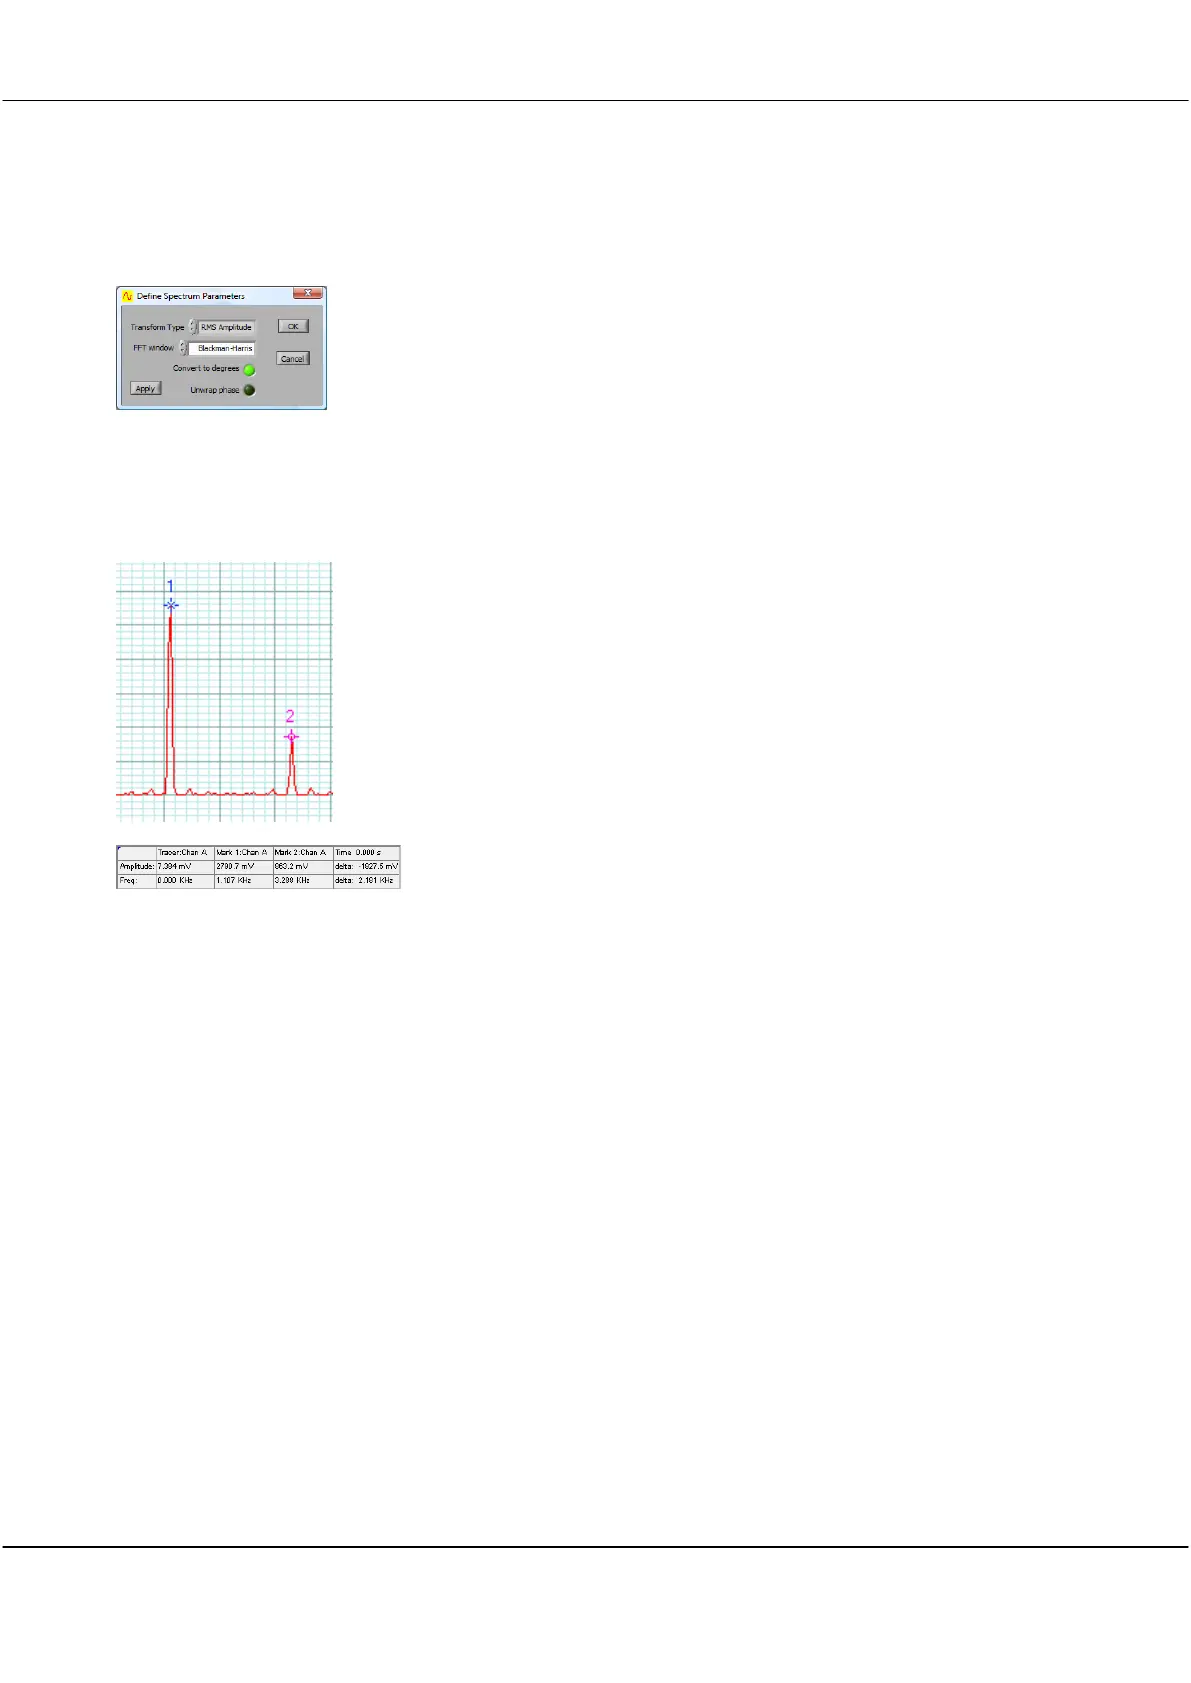
8.1 Spectrum Display Tracer and Markers
As with the Scope Display and Tracking Display, the display controls for the
Spectrum Display work the same way, except that the horizontal axis
represents frequency instead of time.
A tracer may be moved along the spectrum trace in the same way as the
Scope Display.
Markers may be placed on the spectrum trace at points of interest by double
clicking at the desired tracer position.
The Information area displays information about the position of the tracer,
the markers, the amplitude and frequency differences between the markers
and the inverse frequency difference between markers, labelled as time.