Watch a demonstration of live export to Excel using DDE links and logging on the videos page of the Cleverscope
web site “Cleverscope live export to Excel” www.youtube.com/watch?v=lpS2f3Vv6Xc.
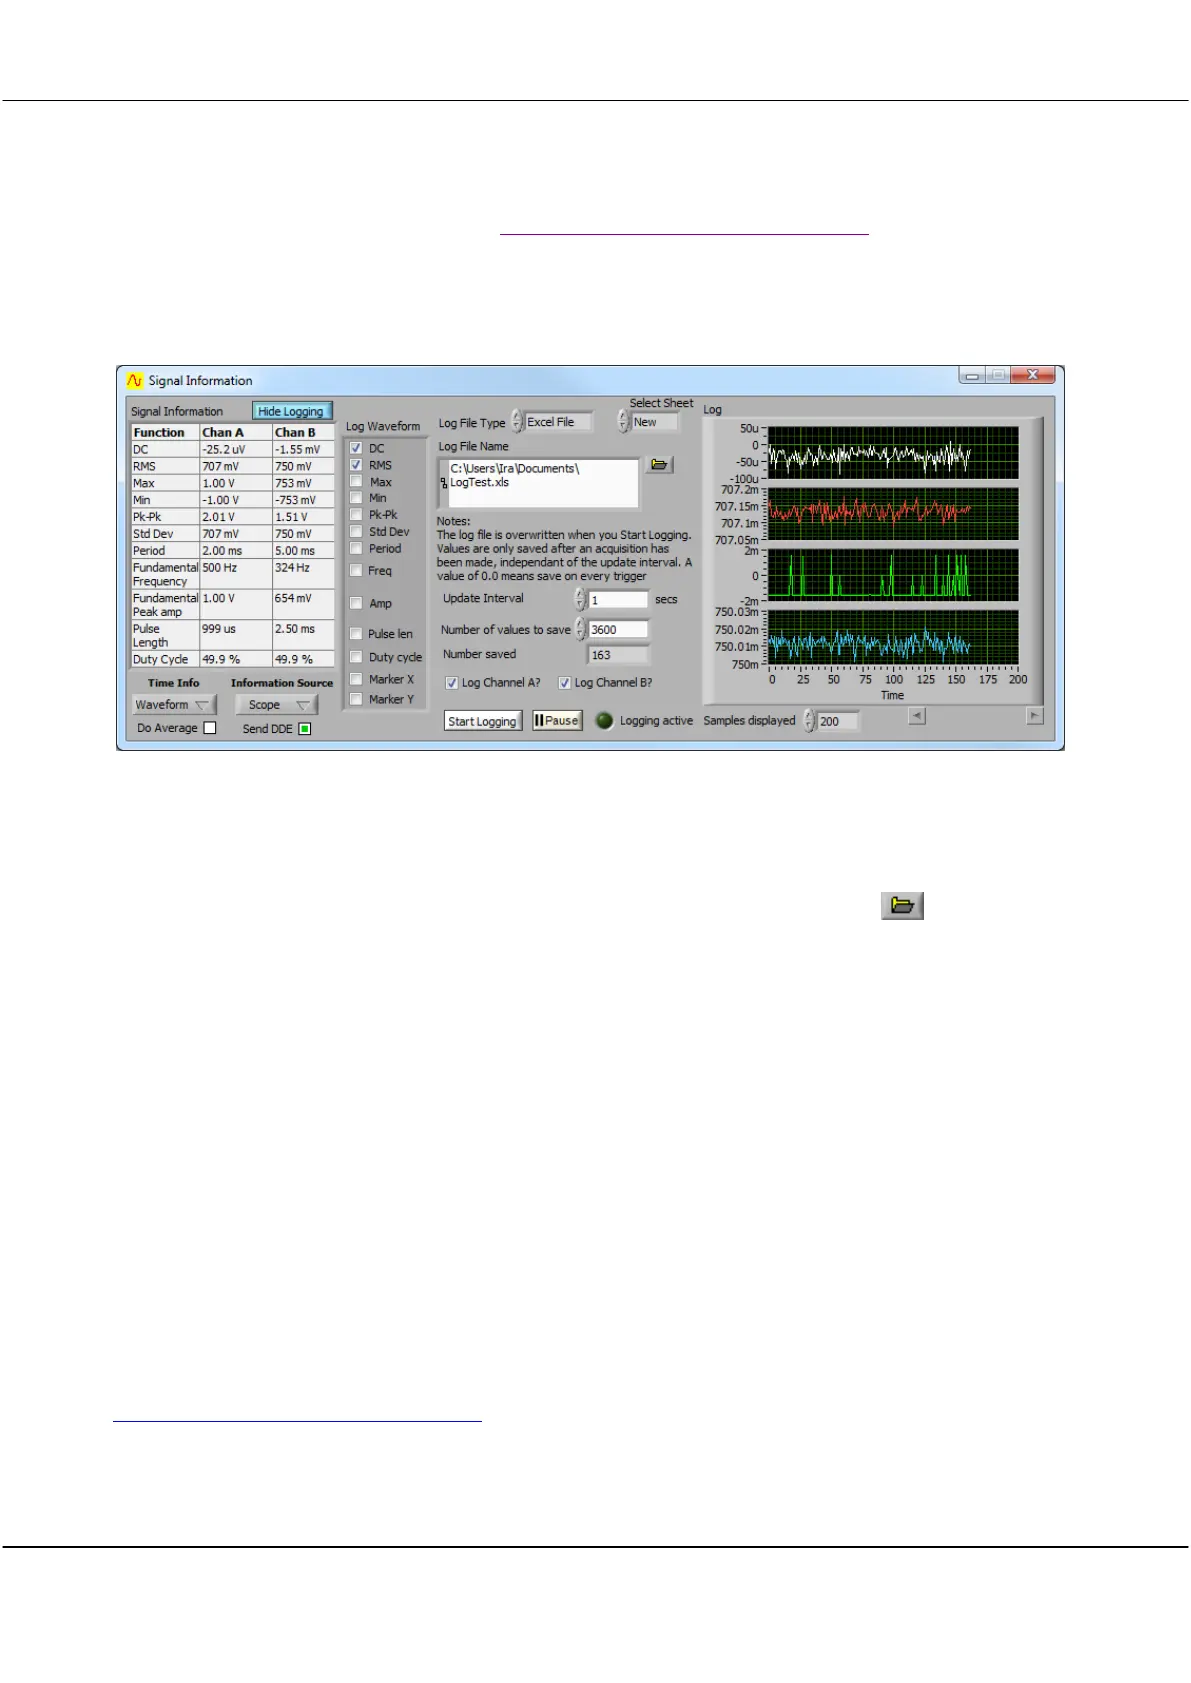
Clicking Show Logging expands the window to show all the logging functions so that available signal
information can be logged.
Select the items to be logged in Log Function? and select to Log Channel A? and Log Channel B?. Choose a Log
File Type of
Text File
or
Excel File
. If
Excel File
is selected, also click Select Sheet to choose whether the data is
logged in a
New
sheet or the
First
sheet. Enter a Log File Name including its path or click to browse to a
file. The logging system can open Excel 2000-2010 and log directly into the spread sheet.
If a Log File Type is
Text File
, you are also able to open the file in the standard Scope Display and see the first
two channels of captured data (use Auto Fit to size the signal to the graph). The saved data includes the 10ns
trigger time, which means the log file can be used to find the exact duration between trigger events.
The Update Interval includes the value 0. This means save every trigger, which can be used for saving at
maximum rate or for sporadic sampling where a trigger only occurs occasionally. An added bonus is being able
to see as much of the captured file as you wish while capturing is happening.
Click Start Logging to start and stop logging. Click Pause to take a break in the logging and click it again to
resume logging. The logging will halt when the Number saved to the log file reaches the Number of values to
save.
Similarly to DDE, if the Information Source is Maths then derived values can be logged via the DC, etc. or
Marker X, Marker Y values.
The Log display graph automatically adapts itself to the number of items selected to be displayed.
Watch a demonstration of live export to Excel using DDE links and logging here
www.youtube.com/watch?v=lpS2f3Vv6Xc.