Cleverscope CS300 Reference Manual v2.11
Page 88 www.cleverscope.com ©Cleverscope 2004-2015
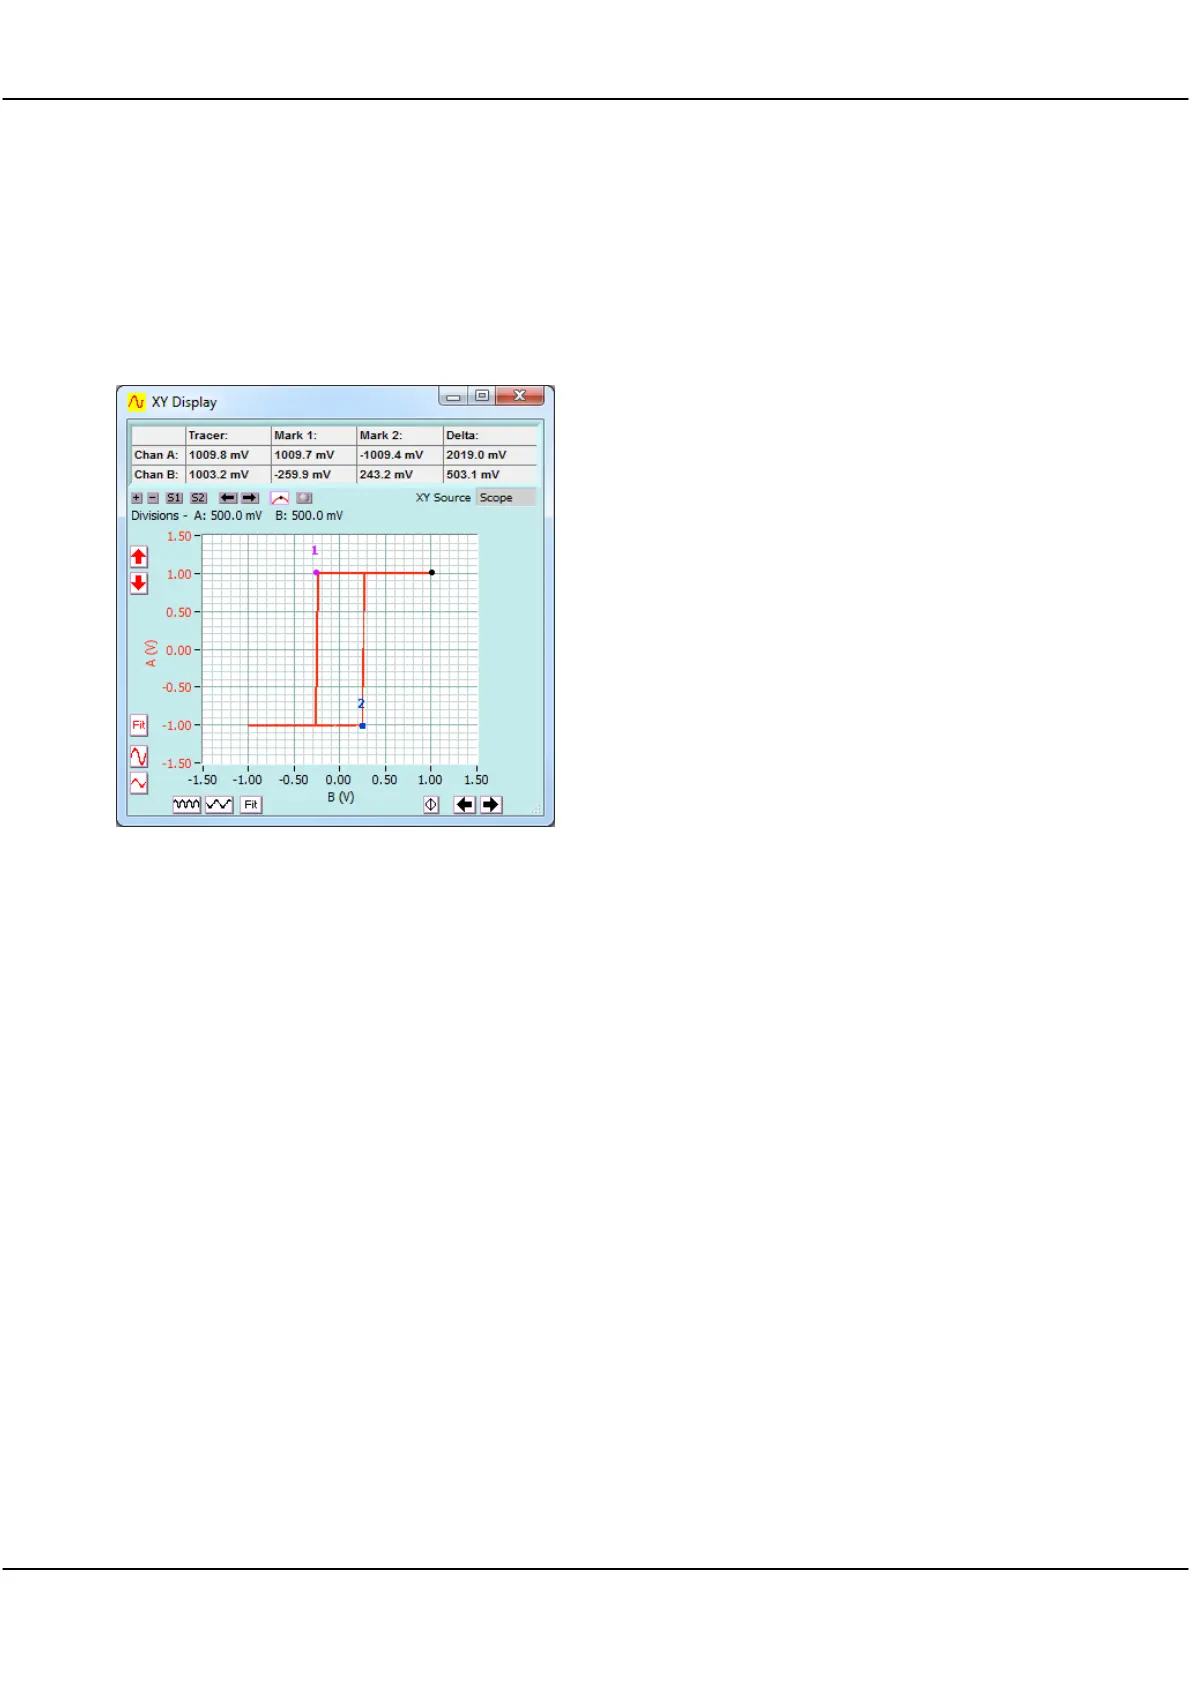
14 XY Display [View Menu]
The XY Display displays the XY plot of the channel A and channel B signal data.
14.1 XY Display Controls
Note: The XY Display has an XY Source control in
addition to the graph setting buttons that appear on all
displays.
Selects the source data from the Scope, Spectrum, Tracking, or Maths display.
14.2 Using the X-Y Display
Select the source data from the Scope, Spectrum, Tracking, or Maths display.