Cleverscope CS300 Reference Manual v2.11
Page 72 www.cleverscope.com ©Cleverscope 2004-2015
11.1 Example Plots
In these example plots we have used two signal sources of very nearly the same 1 kHz frequency. If we trigger
off one, the other plot will move slowly across the screen to the right. This is useful for showing the persistence
effects. We used the Probe Comp and Signal Generator output to make these plots.
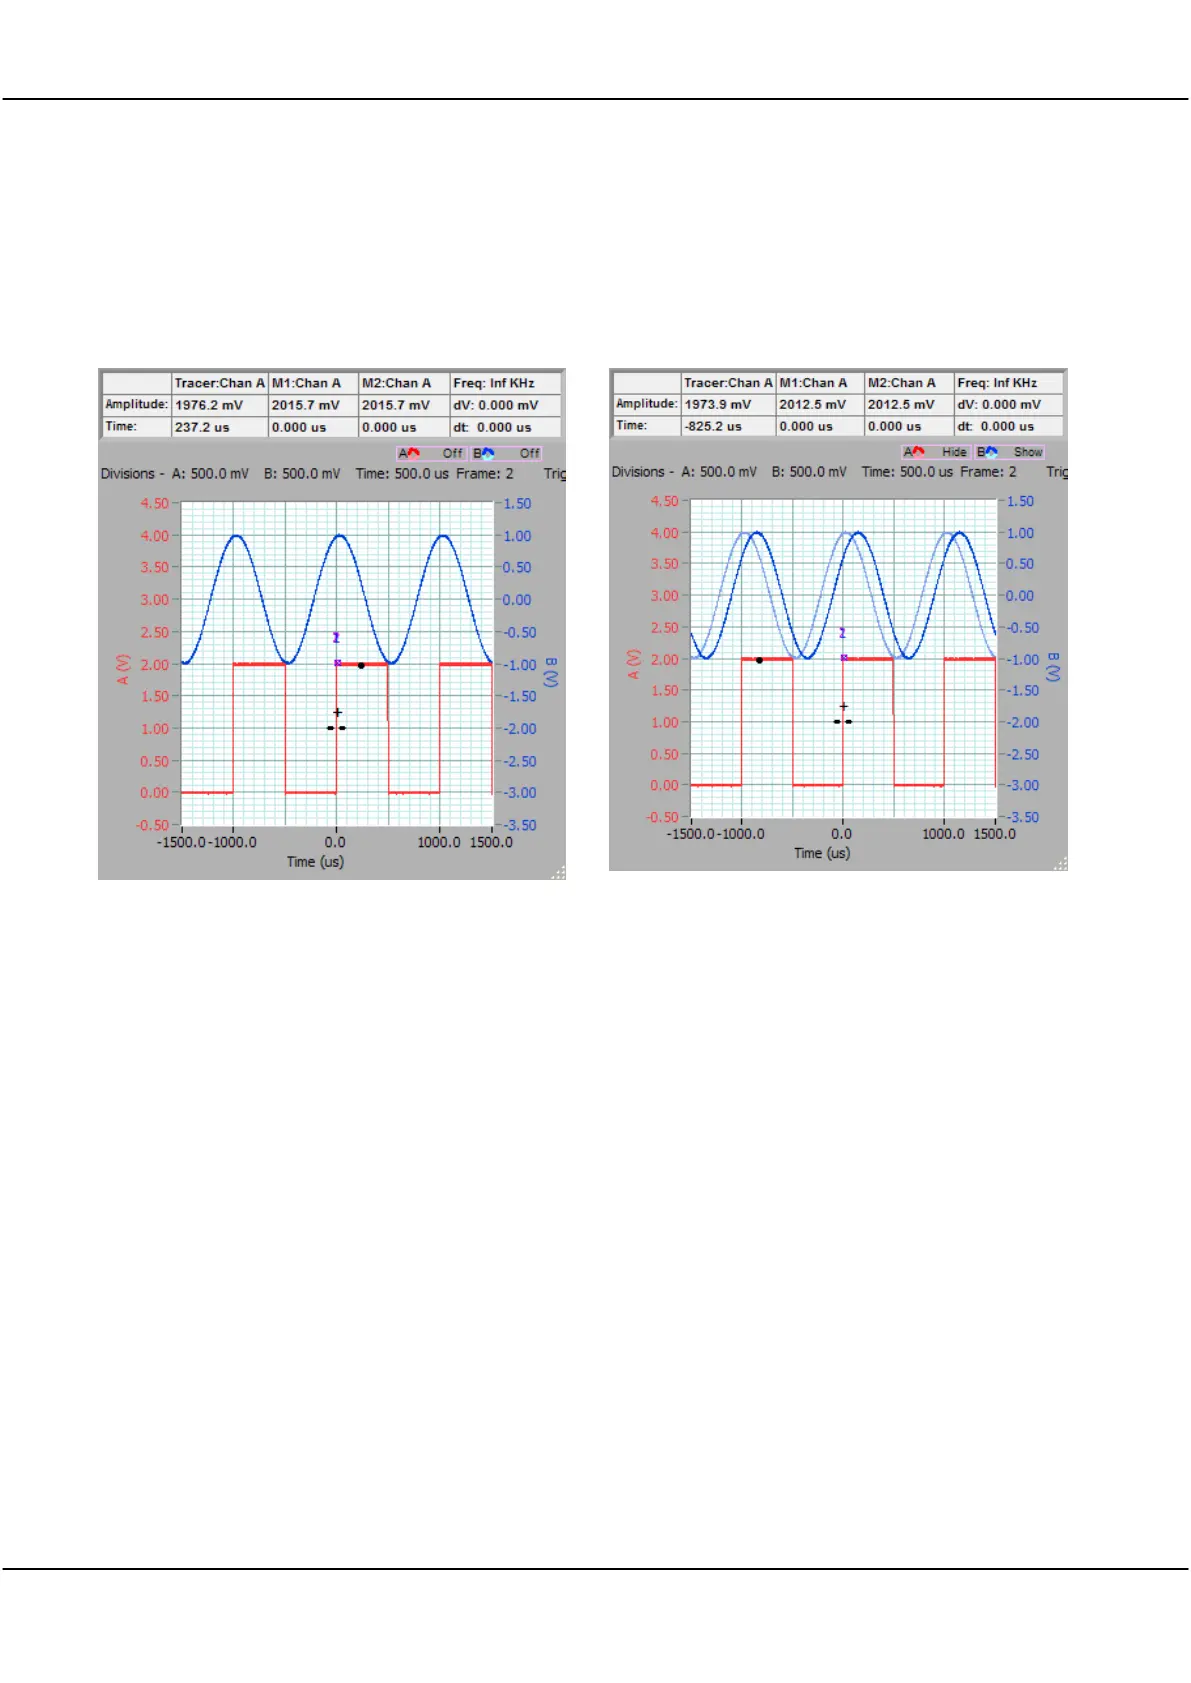
A plot with Persistence Off.
A reference has been added on Channel B.
Notice that the reference appears as a lighter colour line. If you change the time or amplitude axis, the plot will
change to conform to the new graph settings. As you make further captures, you can check the relationship
between the reference and the latest capture.
After using
Addref
, the control automatically changes to
Show
.
If you use
Clear
, the reference will be cleared, and you will see only the latest capture. After using
Clear
, the
control reverts automatically to the last state,
Show
, in this example.