v2.13 Cleverscope CS300 Reference Manual
©Cleverscope 2004-2018 www.cleverscope.com Page 83
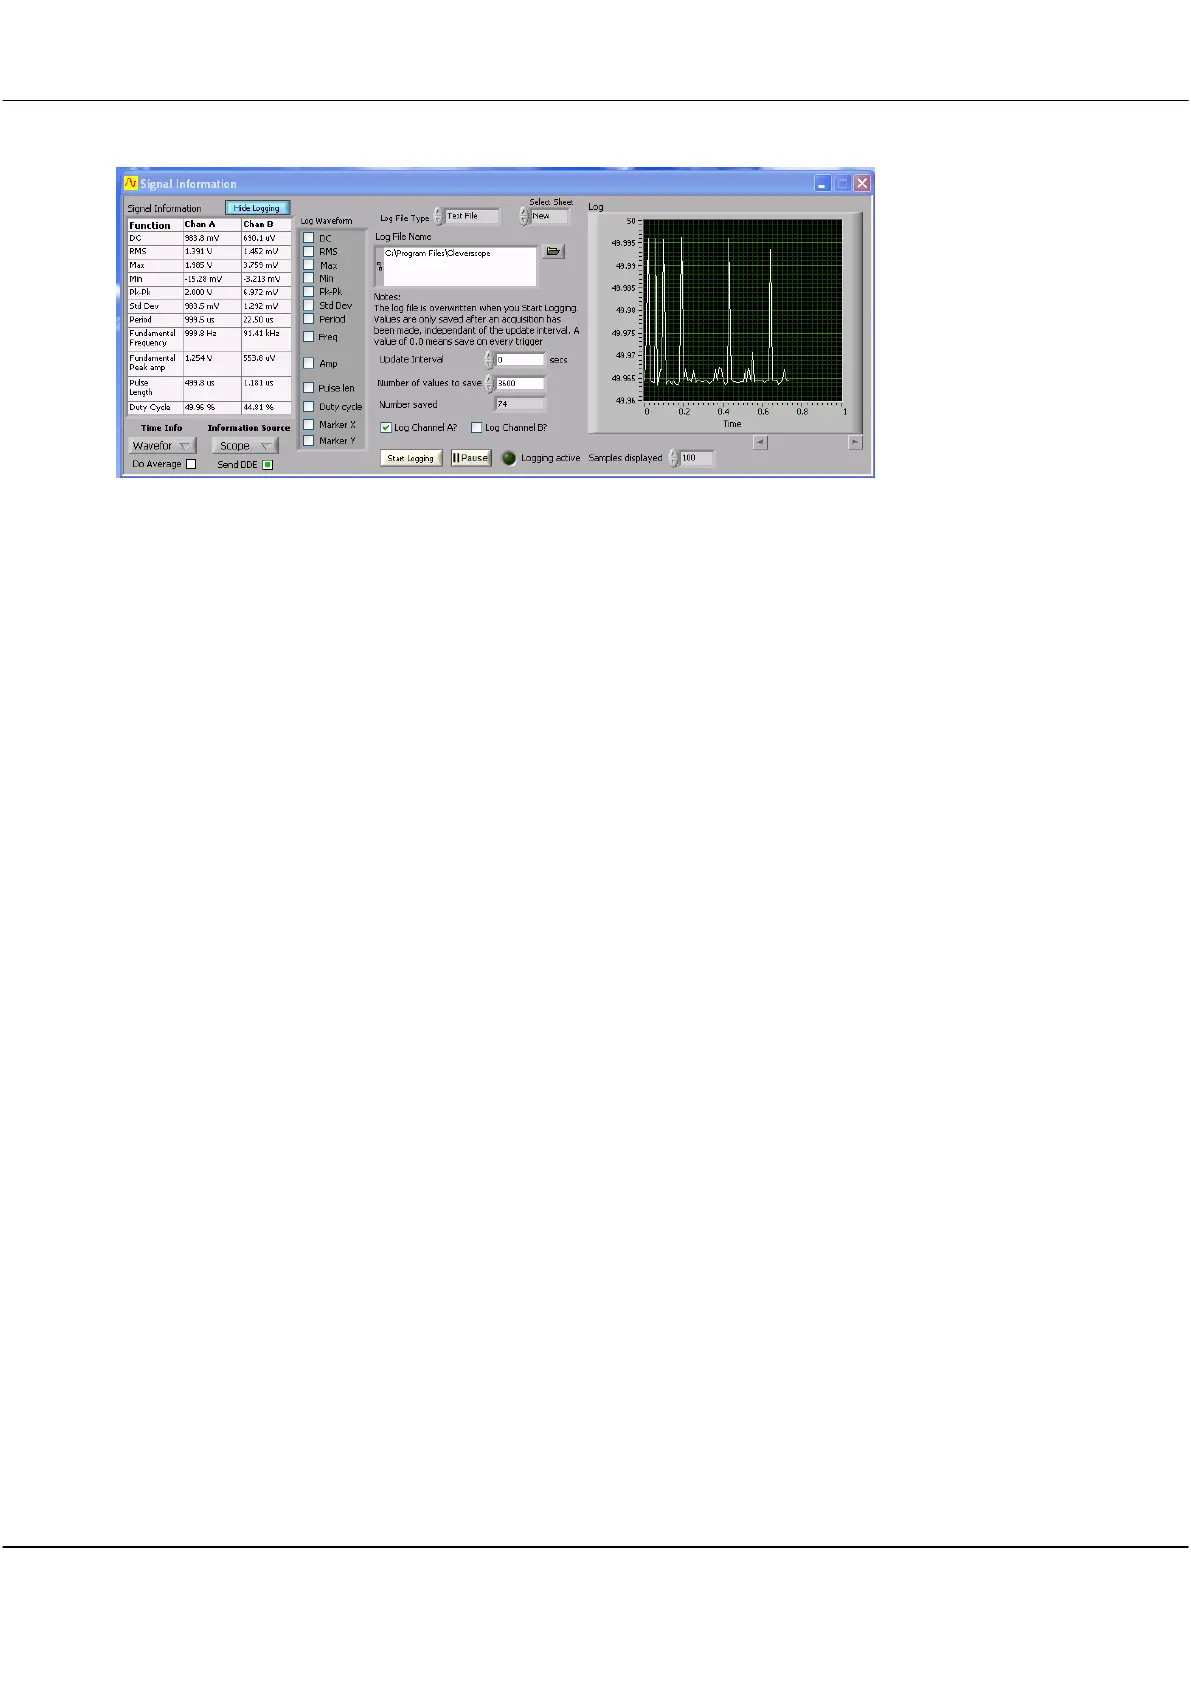
Logging Panel – Scope Source
Click inside the checkbox to log the results of the function.
Click on arrows or in field to select Text or Excel file type.
Click on arrows or in field to select New or First Excel worksheet.
Click into the Log File Name box and type the required file name or click the file open
icon to navigate to a folder, open an existing file to overwrite it, or type in a new file
name.
Click on arrows or in field to select interval in seconds. Maximum value is 60480 seconds.
Click on arrows or in field to select Maximum value is 67108864.
Displays the number of samples captured at the point the log is stopped or reaches the
Number of Values to Save setting.
Click check box to log Channel A.
Click check box to log Channel B.
Start logging
Stop logging
Click button to start logging.
The Show Logging button toggles to green and shows Stop Logging once logging starts.
Indicator glows green when logging in progress.
Click on arrows or in field to select the number of samples to be shown on the log screen.
13.3 Signal Information – Waveform Functions (Scope Source)
This value is calculated by taking the mean amplitude value of the signal data (either full
frame or between tracking markers). It represents the DC offset of the signal data for
which it was calculated.
Root Mean Square –The value is calculated by squaring the value of each sample, taking
the mean value of these squares; and then taking the square root of this mean value. As
for all functions the calculation is either done for the entire frame or between the tracer
markers.