v2.13 Cleverscope CS300 Reference Manual
©Cleverscope 2004-2018 www.cleverscope.com Page 81
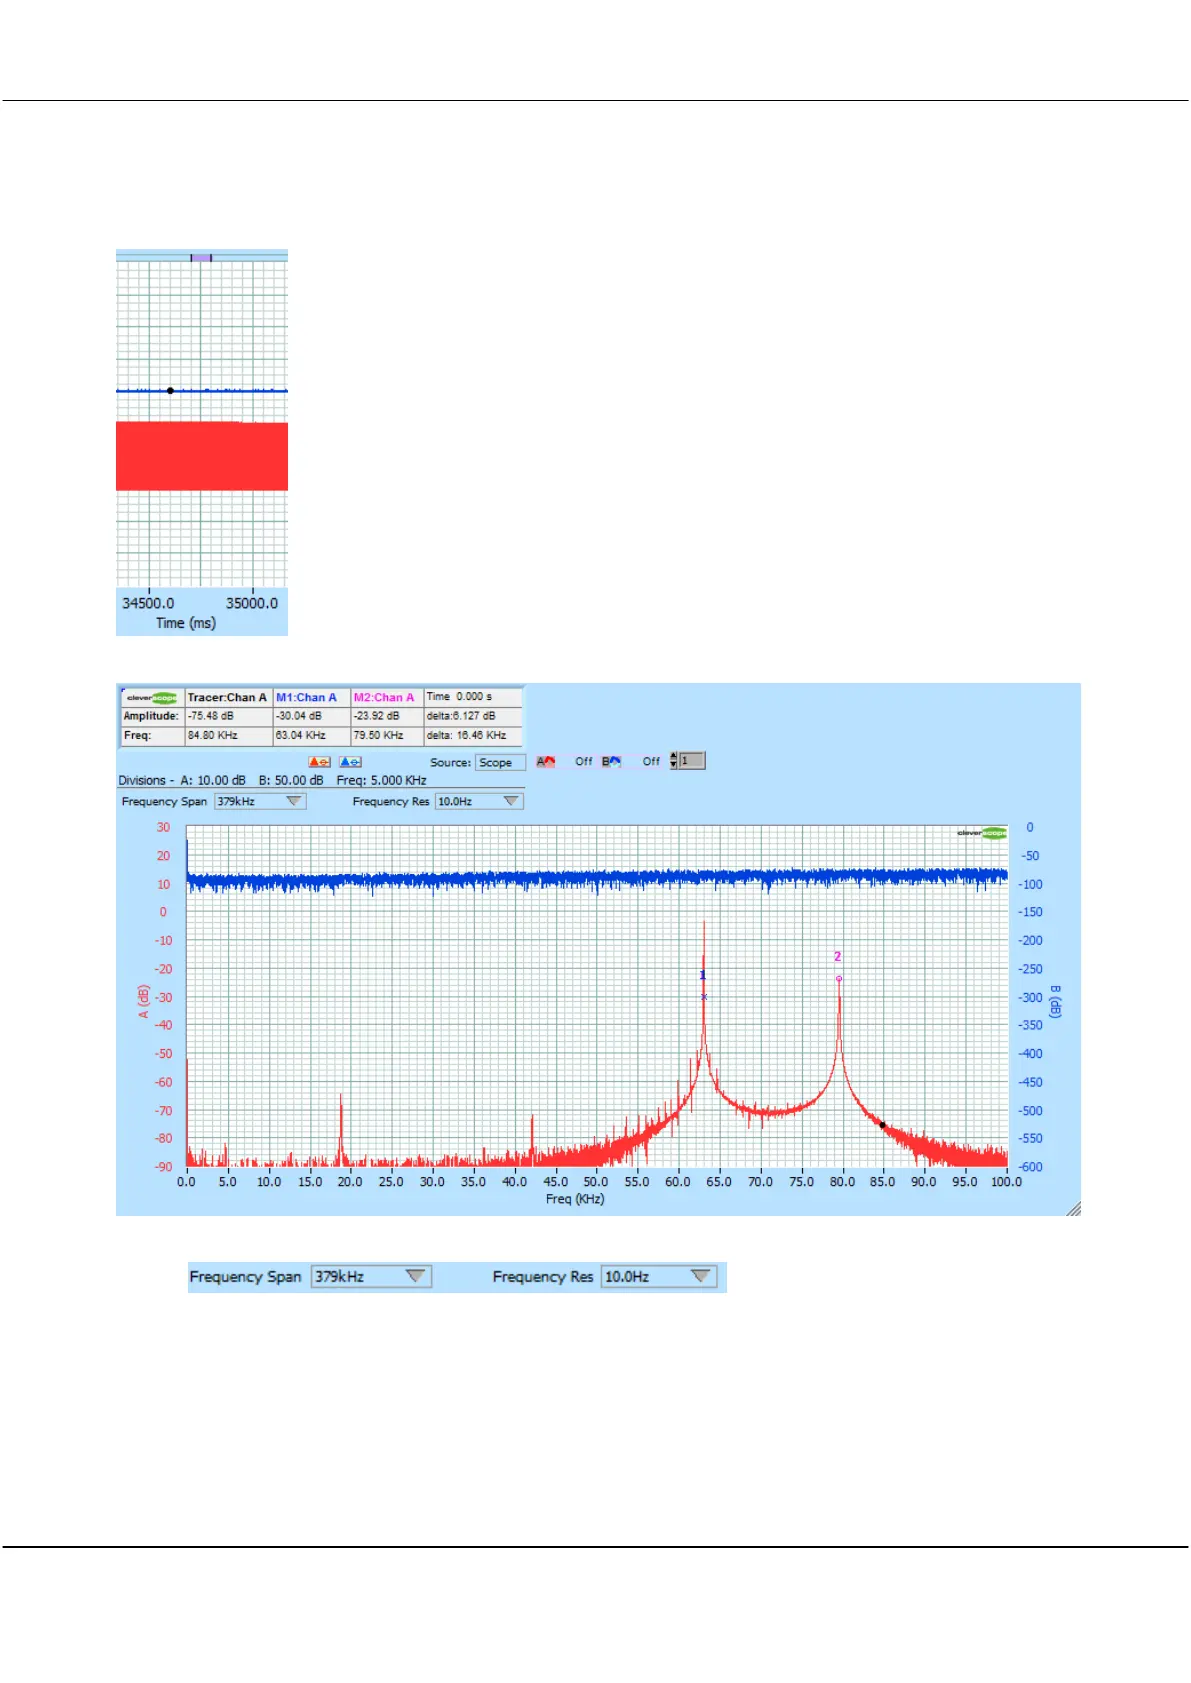
12.5 Spectrum Display of a Stream
We can also open the Spectrum Display (View/Spectrum Display), and do spectral analysis on the section of the
graph identified by the purple bar :
In this section of signal we see the signal generator has transitioned from 63 kHz to 79.5 kHz:
You can set Frequency Spand and Frequency Resolution using the controls:
If you set the Spectrum source to Tracker, and have the Tracking graph open, and following the Scope Display
tracker, you can display the spectrum at any arbitrary place just by position the Tracer there. The same goes for
Maths.
12.6 Open a Stream File
To open a previously saved Stream, either use the File/Most recently used file list, or File/Open, and navigate to
the Stream folder, and then open the .apc file in there.