Cleverscope CS300 Reference Manual v2.11
Page 62 www.cleverscope.com ©Cleverscope 2004-2015
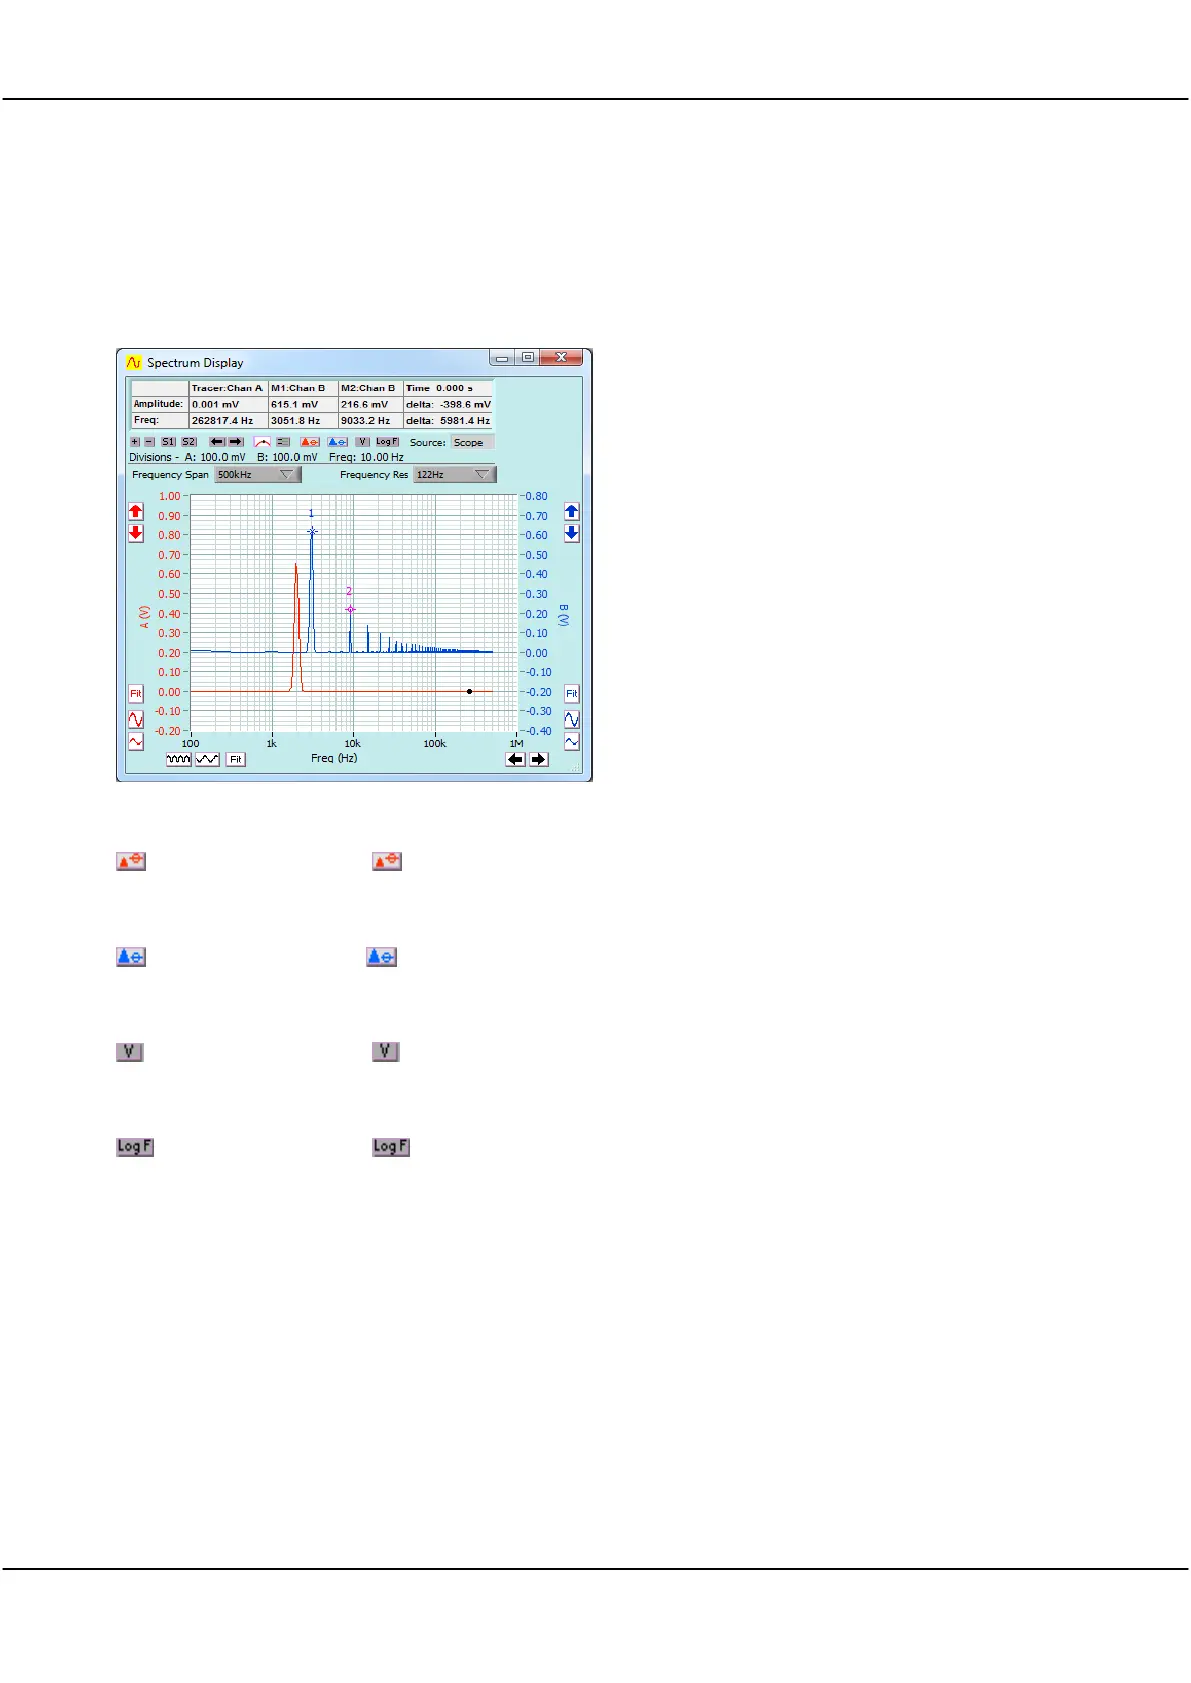
8 Spectrum Display [View Menu]
The Spectrum Display displays the Fourier transform of the channel A and channel B signal data.
The Source for the Spectrum Display can be selected from the Scope, Tracking or Maths display.
Click on the View menu and click on the Spectrum
Display.
The channel A button is shown in the
set peak to 0
dB
position and the channel B button is in the
normal
position.
The Spectrum display has added Tools which are
specific to it.
Spectrum Graph Tools
Click to toggle channel peak value to 0dB as displayed on the graph.
Click to toggle channel peak value to 0dB as displayed on the graph.
Click to toggle between Voltage and dB scales.
Click to toggle between linear and log scales.
Click to select Scope, Tracker, or Maths as the signal source for the Spectrum display.
Click on the button and select the spectrum analysis frequency span for the Spectrum
Display.
Click on the button to select the spectrum analysis resolution for the Spectrum Display.
The resolution is increased by increasing the number of samples returned from the
capture unit to the spectrum analyzer.
Cleverscope allows a spectral resolution of 1 part per million and supports a frequency resolution limited only by
the sampling duration (Tdur) and sampling interval (dT). By balancing dT and Tdur, appropriate choices for
Frequency Span and Resolution to make best use of the deep memory sample buffer can be made. Increasing
Tdur increases Frequency Resolution.