v2.13 Cleverscope CS300 Reference Manual
©Cleverscope 2004-2018 www.cleverscope.com Page 69
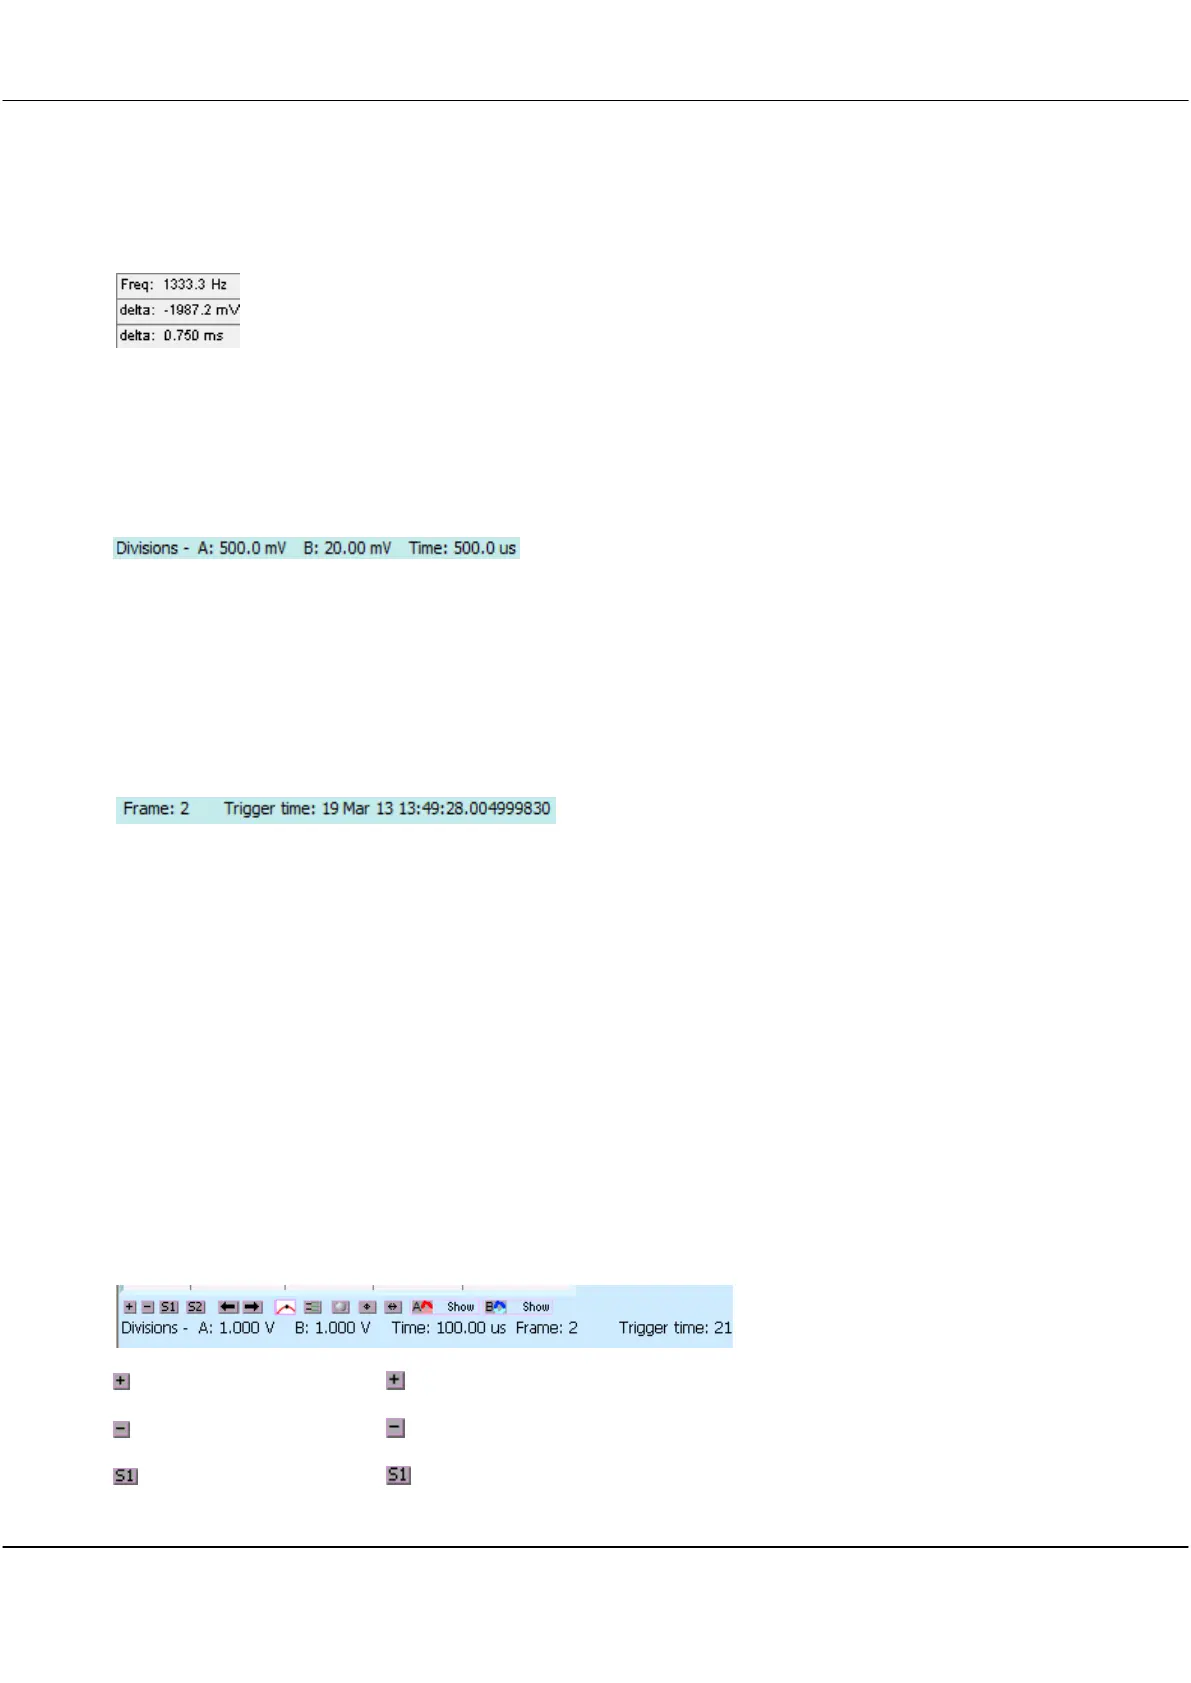
10.5 Using Markers to Measure Differences and Frequency
You measure differences by placing two markers, and then
reading the differences in the right most Information box.
In the example above the time difference is 0.75 ms.
You can measure differences between plots by placing the
first marker, and then pressing the Tab key to move from one
plot to the next, and placing the second marker.
Also displayed in the Information area are the differences in
voltage and time (delta) between the two markers. The Freq
value is the inverse of the time delta.
Volts/Division and Secs/Division for A and B channels are
displayed above the top left hand side of the graph.
10.6 Cleverscope Displays - Frame and Trigger Time Stamp
gives the Frame number for the graph currently displayed.
The trigger time stamp is maintained by the CLEVERSCOPE, as a 64 bit word with 10ns
resolution (5,865 years).
Each trigger is time stamped with the real time to 10ns resolution.
The trigger time is displayed above the graph on the right, and is also used to time stamp the
protocol decodes.
In addition the trigger time can be used by the Maths system to calculate the time difference
between triggers.
Any saved files (.apc and text) are time stamped with the trigger time.
Note: You may need to drag the window wider to see the whole time stamp.
10.7 Cleverscope Displays - Graph Tools
Cleverscope has a series of buttons between the graph and the information area that control graph settings.
Click button to zoom in on both channels at the same time.
Click button to zoom out on both channels at the same time.
Click button to restore graph setup 1.