Cleverscope CS300 Reference Manual v2.11
Page 28 www.cleverscope.com ©Cleverscope 2004-2015
Note: As the tracer is moved along a signal (or spectrum) its position in both
amplitude and time (or frequency) is displayed in the Information area at the top of
the display graph. The tracer assists the accurate positioning of markers which enable
points of interest to be tagged and calculations on selected segments of signal data to
be undertaken.
See also the section on Scope Display for a description on the use of the tracer and
markers.
Cleverscope lets you save signal data as either a Cleverscope, text or binary file.
On the File menu, click either Save As, Save as Text, Save as Binary or Save to do this.
The file path for the last stored file is displayed in the path display box.
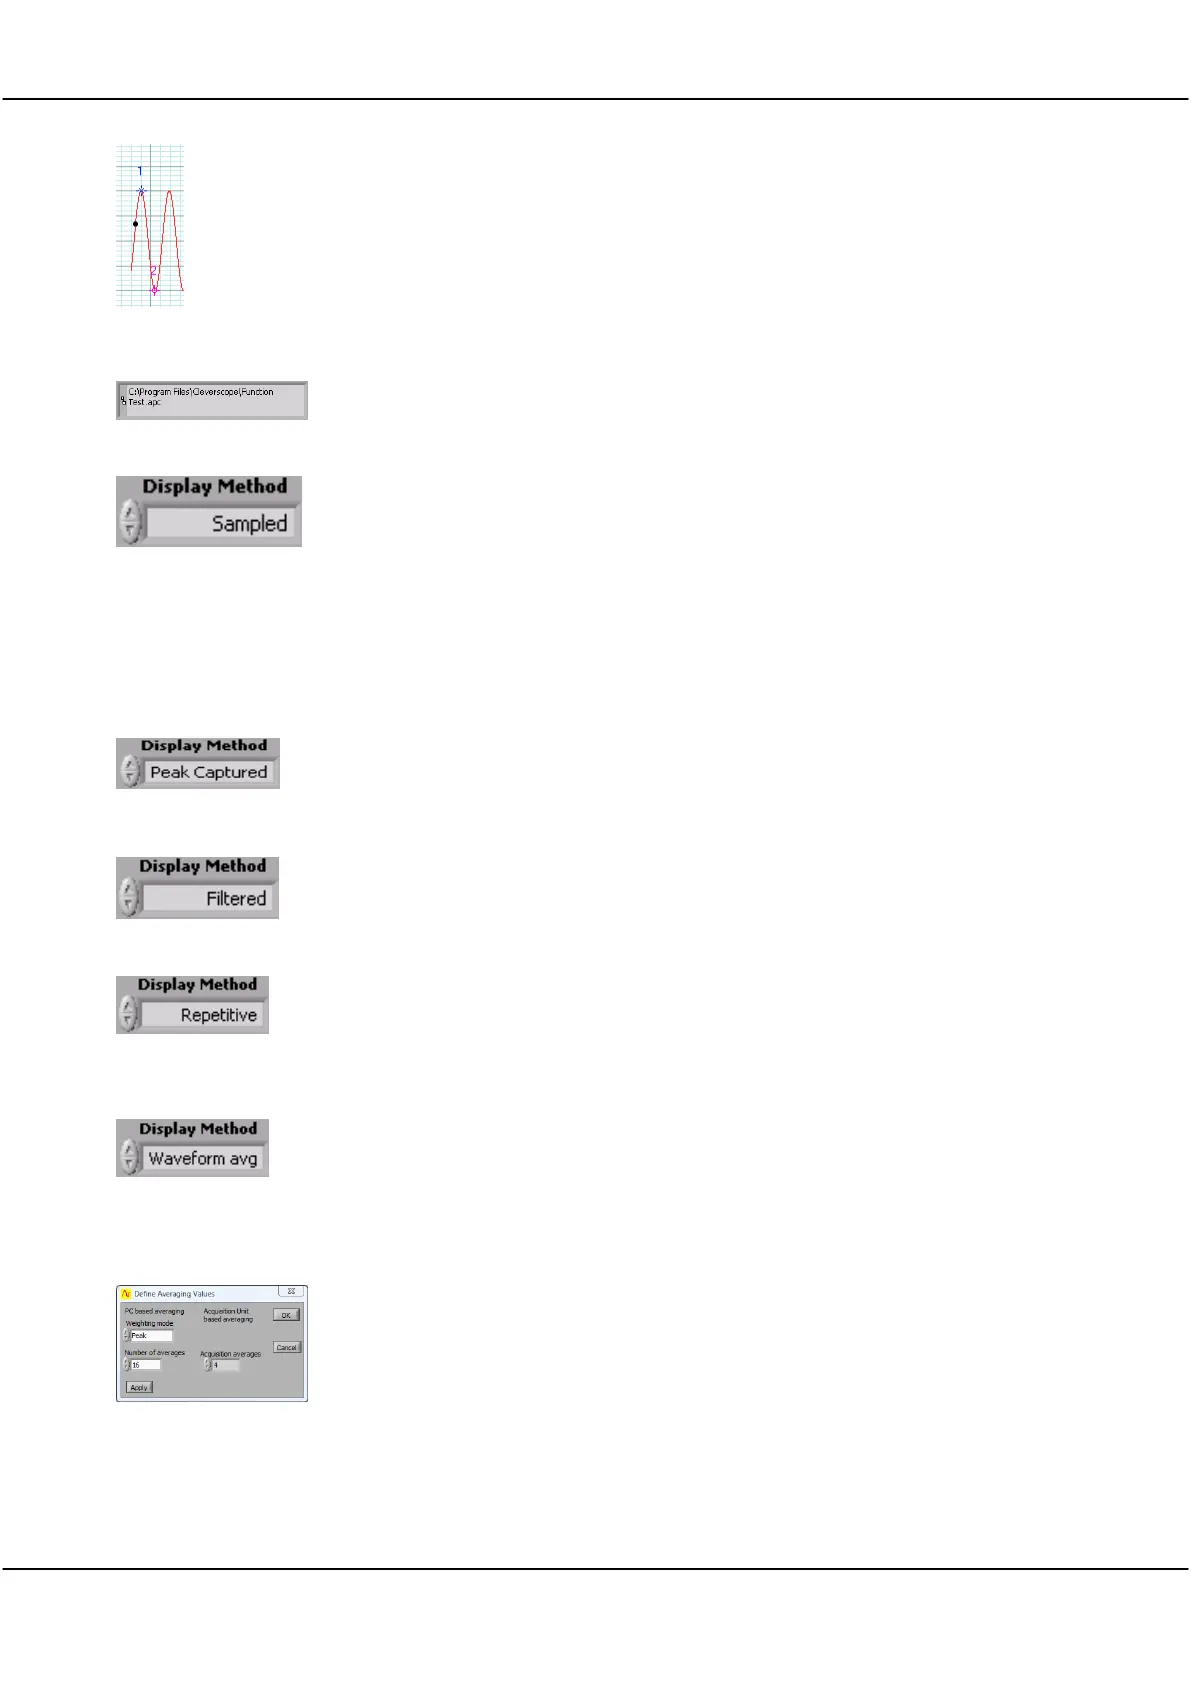
Display Method selects the method of displaying signal data.
Click the arrows or inside the field to select a Display Method from the dropdown list
Note: Samples are taken at regular intervals from the sample frame.
None of the intermediate samples are displayed, which means that some signal
information, such as high frequency signals, or pulses will not be seen.
The sampling interval depends on the maximum frequency or time resolution required
to be displayed and is automatically selected by Cleverscope depending on display
settings.
All samples are processed, with both the minimum and maximum value of the signal
being displayed at every pixel point on the screen.
Hidden pulses will become visible, and high frequency content will be seen as a solid
bar on the screen.
A 1
st
order low pass filter with a corner frequency of 1 MHz is applied to the recorded
samples. Filtering may be useful when viewing low frequency (<500 kHz) signals at
low levels, as sample noise is significantly reduced.
The acquired signals are repetitively sampled over many points to build up a picture of
one cycle of the signal. This results in high frequency repetitive waveforms being
displayed with greater time resolution.
Note: This method only works with repeating signals of greater than 1 MHZ
frequency.
Waveform averaging is performed in the Cleverscope Acquisition Unit (CAU). The
CAU captures multiple frames in quick succession, averages these frames, and
transfers the result to the PC.
This is much faster than averaging in the PC. See the Averaging section below for PC
based averaging.
On the Settings menu, clicking Averaging allows you to select the Acquisition
averages that are used when Waveform avg is selected. The choices are 4, 16, 64, or
128. A higher number increases the averaging.
Waveform averaging requires a stable trigger and is only active when Triggered
acquisition is used. Waveform averaging automatically increases the number of frames
being recorded to one more than the waveform averages selected. Once you
complete using waveform averaging you may wish to set the number of frames to a
lower number to increase time resolution.