129 / 374
SOCT User Manual Version 10.0 rev. A
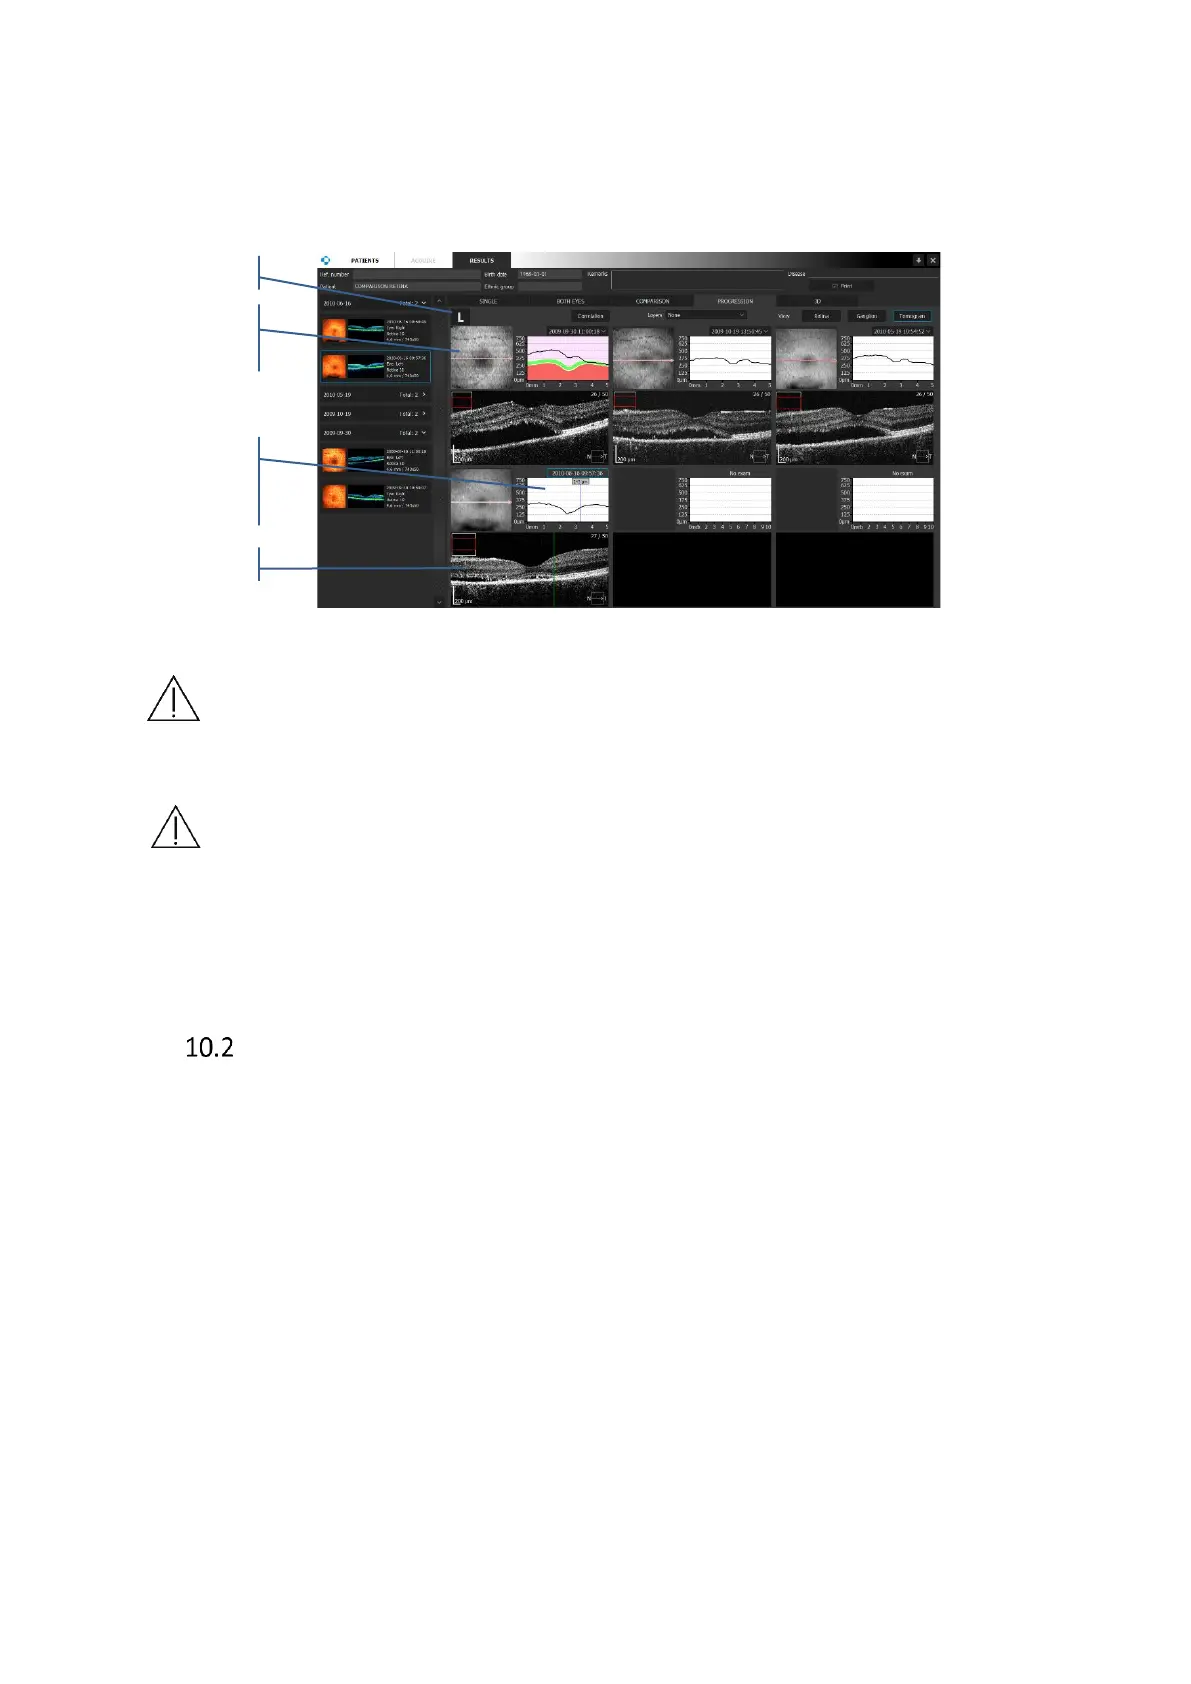
10.1.4.3 Tomogram view
On the tomogram view tab, the software displays tomograms and fundus reconstruction of
each compared examination. The user can manually select examinations from the list. Press
“V” icon near the time of examination to open selection list.
Figure 99. Comparison of the tomograms from succeeding examinations
NOTE: Pay attention when you evaluate the tomogram with different parameters
setting and/or with different scanned widths, proportion of retina shape may not
be kept.
NOTE: Pay attention when you evaluate the tomograms on the Quick Printout if
scanned widths were different between examinations.
This shows the tomogram image from the macula up to the optic disc, and analysis results of
retinal thickness.
OPTIC NERVE HEAD ANALYSIS
This shows the thickness of NFL (Nerve Fiber Layer) and analysis results of the shape of the
optic nerve head. The compatible scan mode is [Disc 3D].
The measurement result of the optic disc and TSNIT region is analyzed based on the captured
OCT image of the optic disc in the [Disc 3D] mode. The results of RNFL analysis are shown, for
example, as a map relating to the RNFL thickness, RNFL profile indicating the thickness of
locations through which a measurement circle (diameter 3.45 mm centering on the optic disc)
passes, and RNFL grid indicating the thickness of the region inside the measurement circle.
The results of shape analysis of the optic disc are shown in Disc, Cup, Rim, and other ONH
parameters.
These analysis results can be shown on the [Single] [Both Eyes] and [Progression] tab screens.