59 / 374
SOCT User Manual Version 10.0 rev. A
Note There are several conditions in which auto functions processes could fail.
For example: dense media opacities, eyelashes or eyelid which block the beam
of light, inability of subjects to maintain fixation, strong nystagmus. When
adverse condition occurs optimize the OCT signal manually.
Note For patients with refraction error bigger than -/+ 5D it is recommended to
fill rough refraction value during adding patients to the system.
Note Before first retina scan examination, if you set the rough focus value
(refraction power compensation) the system will align the patient data form
according to patient correction for Left and Right eye.
Note It is recommended to verify the refraction compensation set
automatically. In case of Auto focus Error function or low QI identifier value try
experimentally checking the refraction power above and under initial value in
order to obtain the best saturation of scans and highest QI value.
Double click on the refraction value resets value to 0.00D.
When cursor is over focus control panel, mouse scroll enables to compensate refraction.
Lines on the vertical and horizontal window indicate proper position of tomograms.
Selection of scan pattern mode
On opening the Acquire tab, the Retina 3D scan pattern is selected by default. You may select
any pattern mode or scan program by clicking it. Depending on scan pattern different result
analysis views are available. In order to combine more than one type of scanning program a
protocol can be used. System automatically changes the working distance.
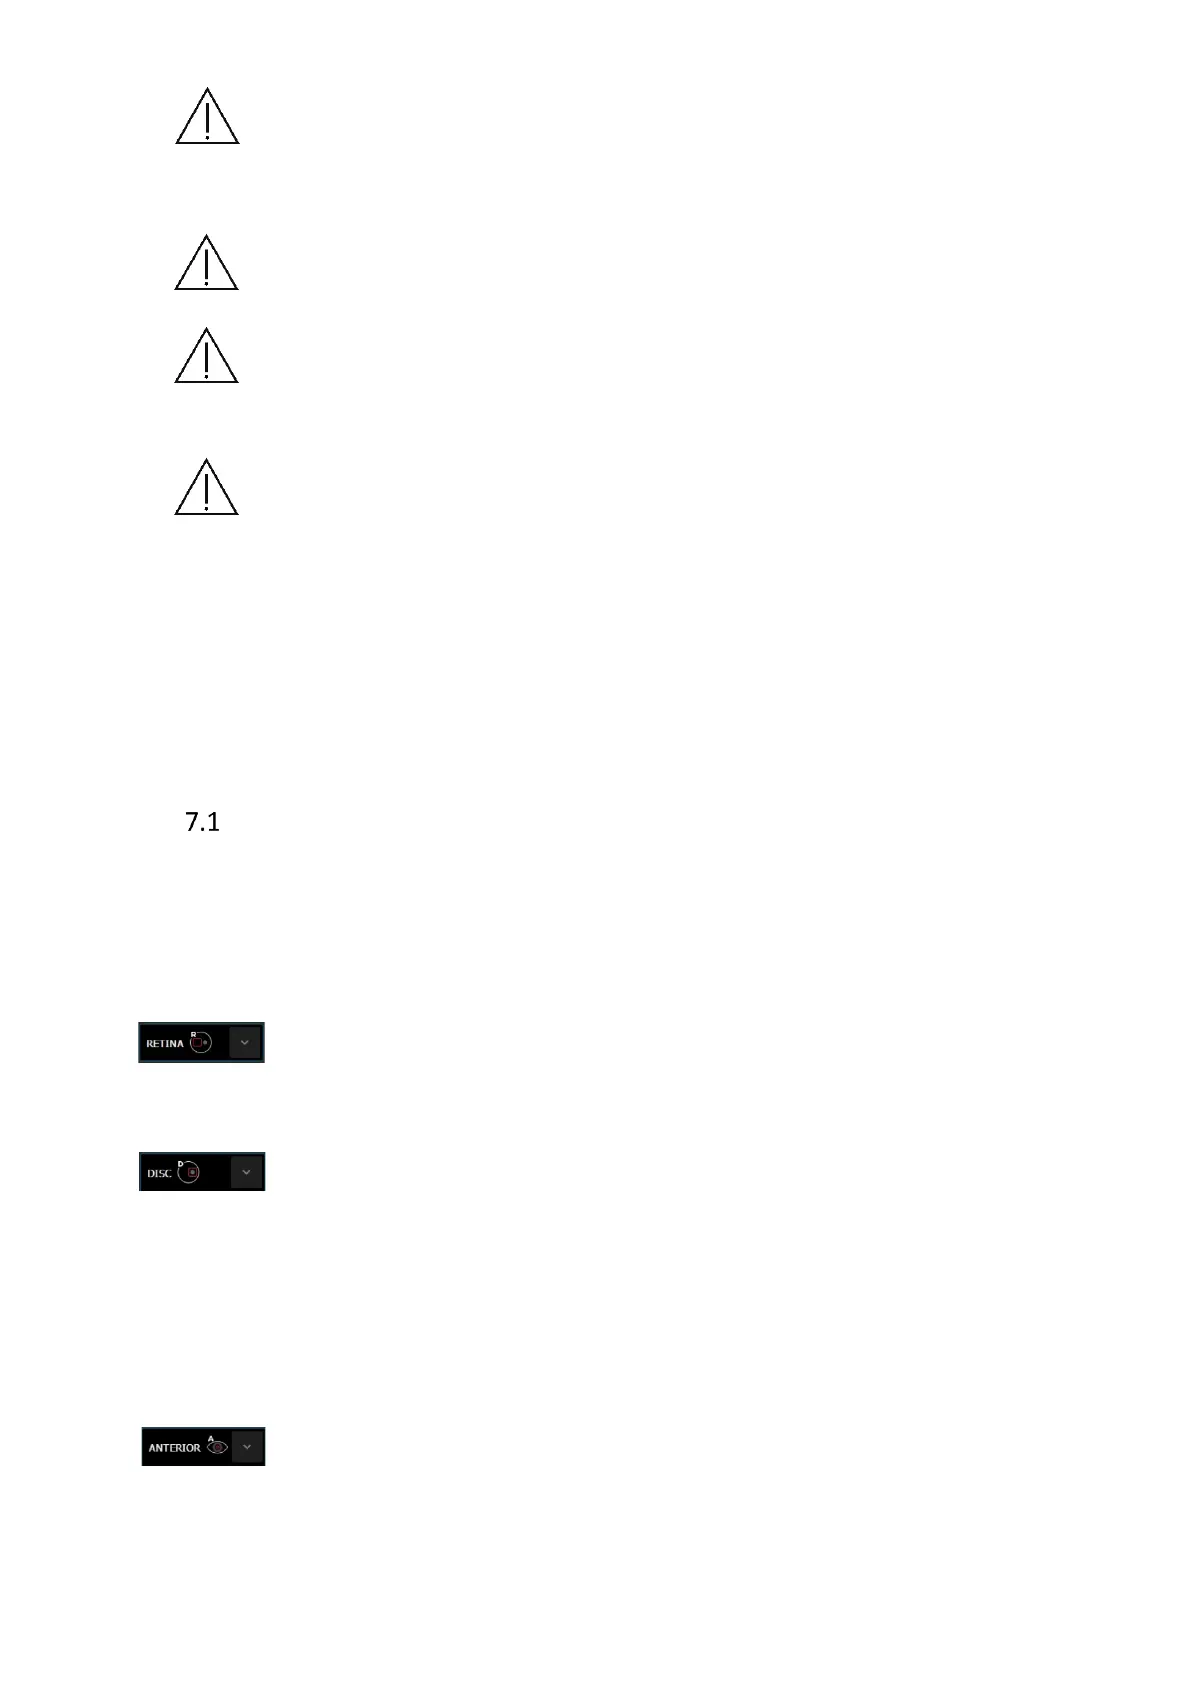
Retina: Fixation position central: The result shows the tomogram image of the macula
and analysis results of retinal analysis for retinal disease and fibers analysis.
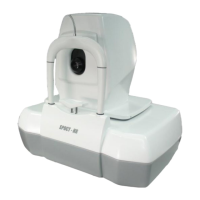
Disc: The fixation target is offset to allow the center of the optic nerve to move to the
center of the scanned area. The scan pattern overlay consists of concentric
rings to assist in the alignment of the optic disc in the center of scanned area.
The result shows the tomogram images of the optic disc, results of thickness of
RNFL (Retinal Nerve Fiber Layer) analysis, and quantification of the morphology
of the optic disc.
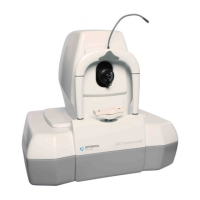
Anterior: The result shows the tomogram image of the anterior segment and analysis
result of the cornea analysis. This section has three groups of scan programs:
[Anterior] group - width of scan programs are 3 - 5 mm.