Example:
Let us assume that L35 is equal to 76.8 dB. It
means that during the measurements the
noise level 76.8 dB was exceeded in not more
than 35% of the observation period.
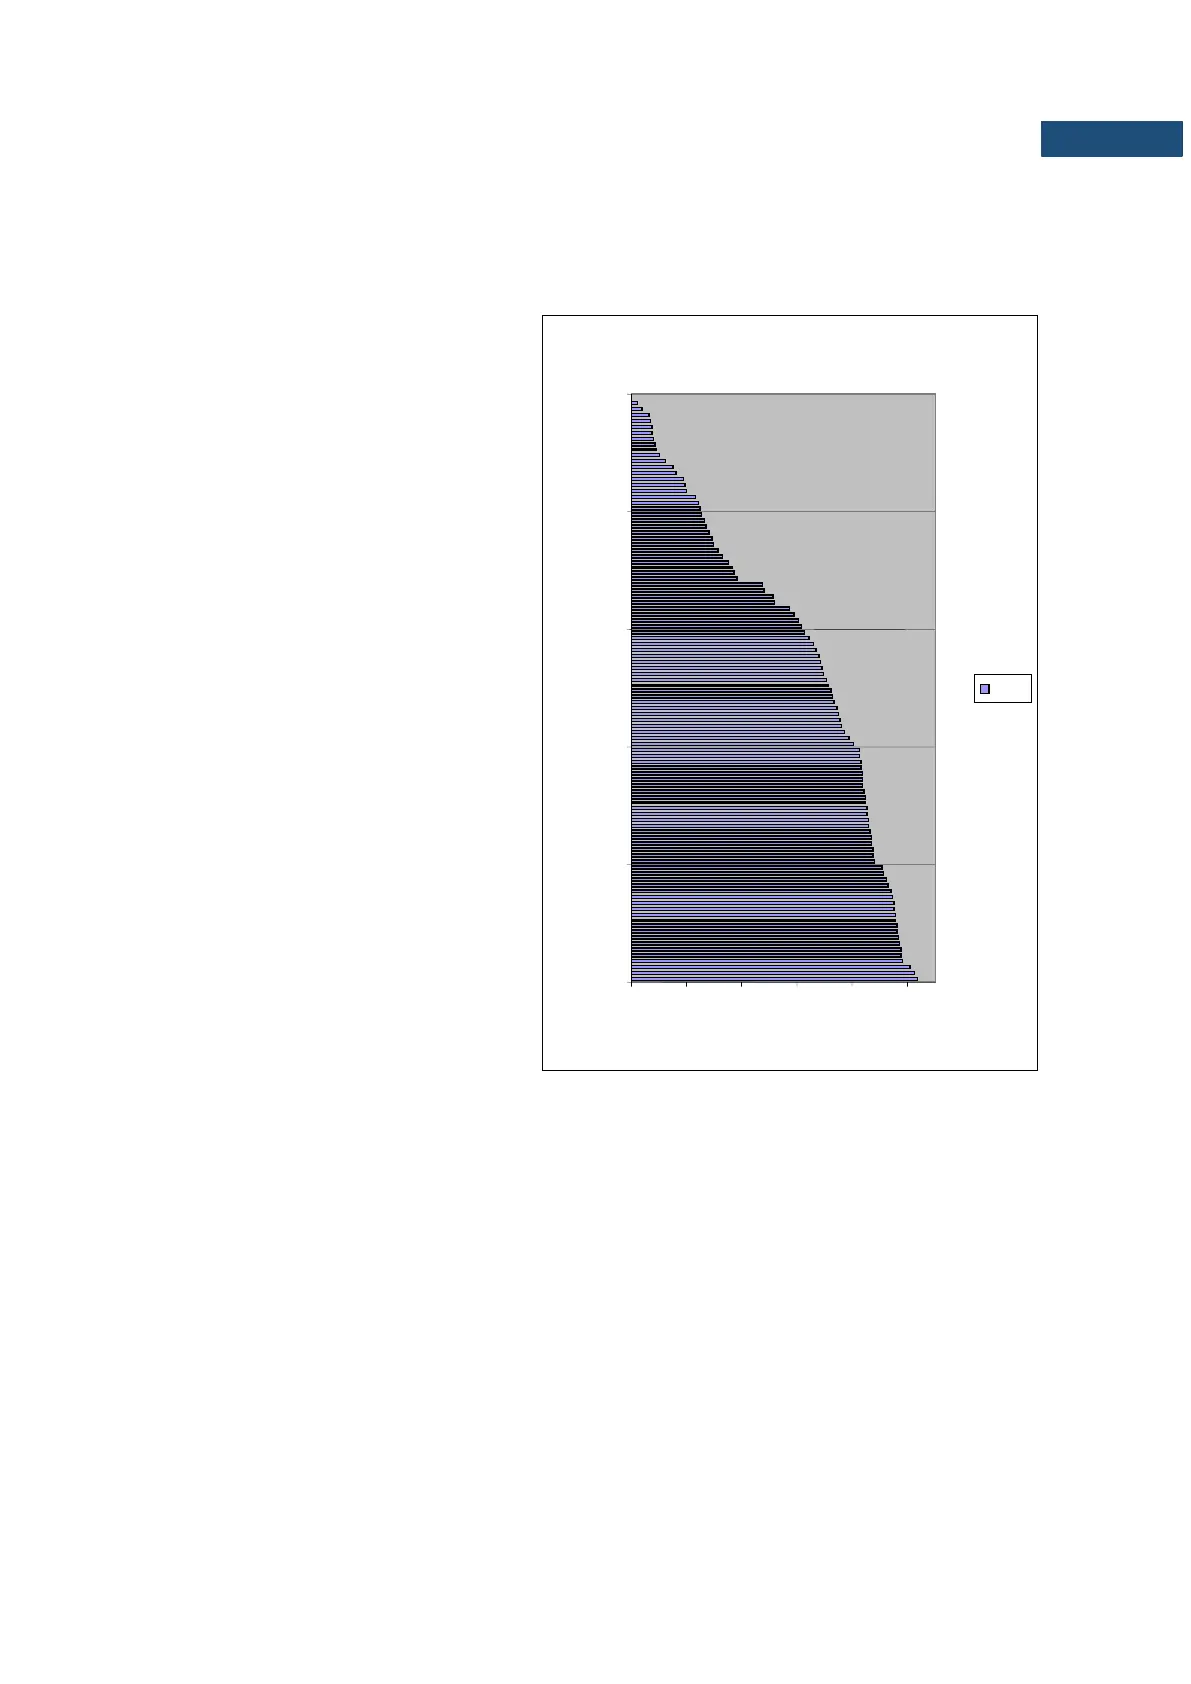
The cumulative density function for the
exemplary data is presented in Figure on the
right side. In order to determine the LN% level
one has to draw the horizontal cursor and find
out the crossing point between the cumulative
density function and the cursor. In the
instrument the user can determine 10
statistical levels - from L01 to L99 (1% step
of observation period).
The display in the instrument presents only
first statistical level N1 (set to: L01 up to L99).
The statistical level LN% value, the profile’s
number the statistics are taken from, the RMS
detector (Lin., or Exp.: Fast, Slow or Imp.),
the filter’s name (A, C or Z) and real time are
displayed in the top-right side of the display in
one-result view mode.