12.3 DISPLAY OPTIONS IN FFT ANALYSIS MODE
The Display Setup list is used for setting the
various parameters which are mainly
dedicated for the control of the spectrum view.
The following lists contain the elements that
influence the presentation of the results of
FFT analysis:
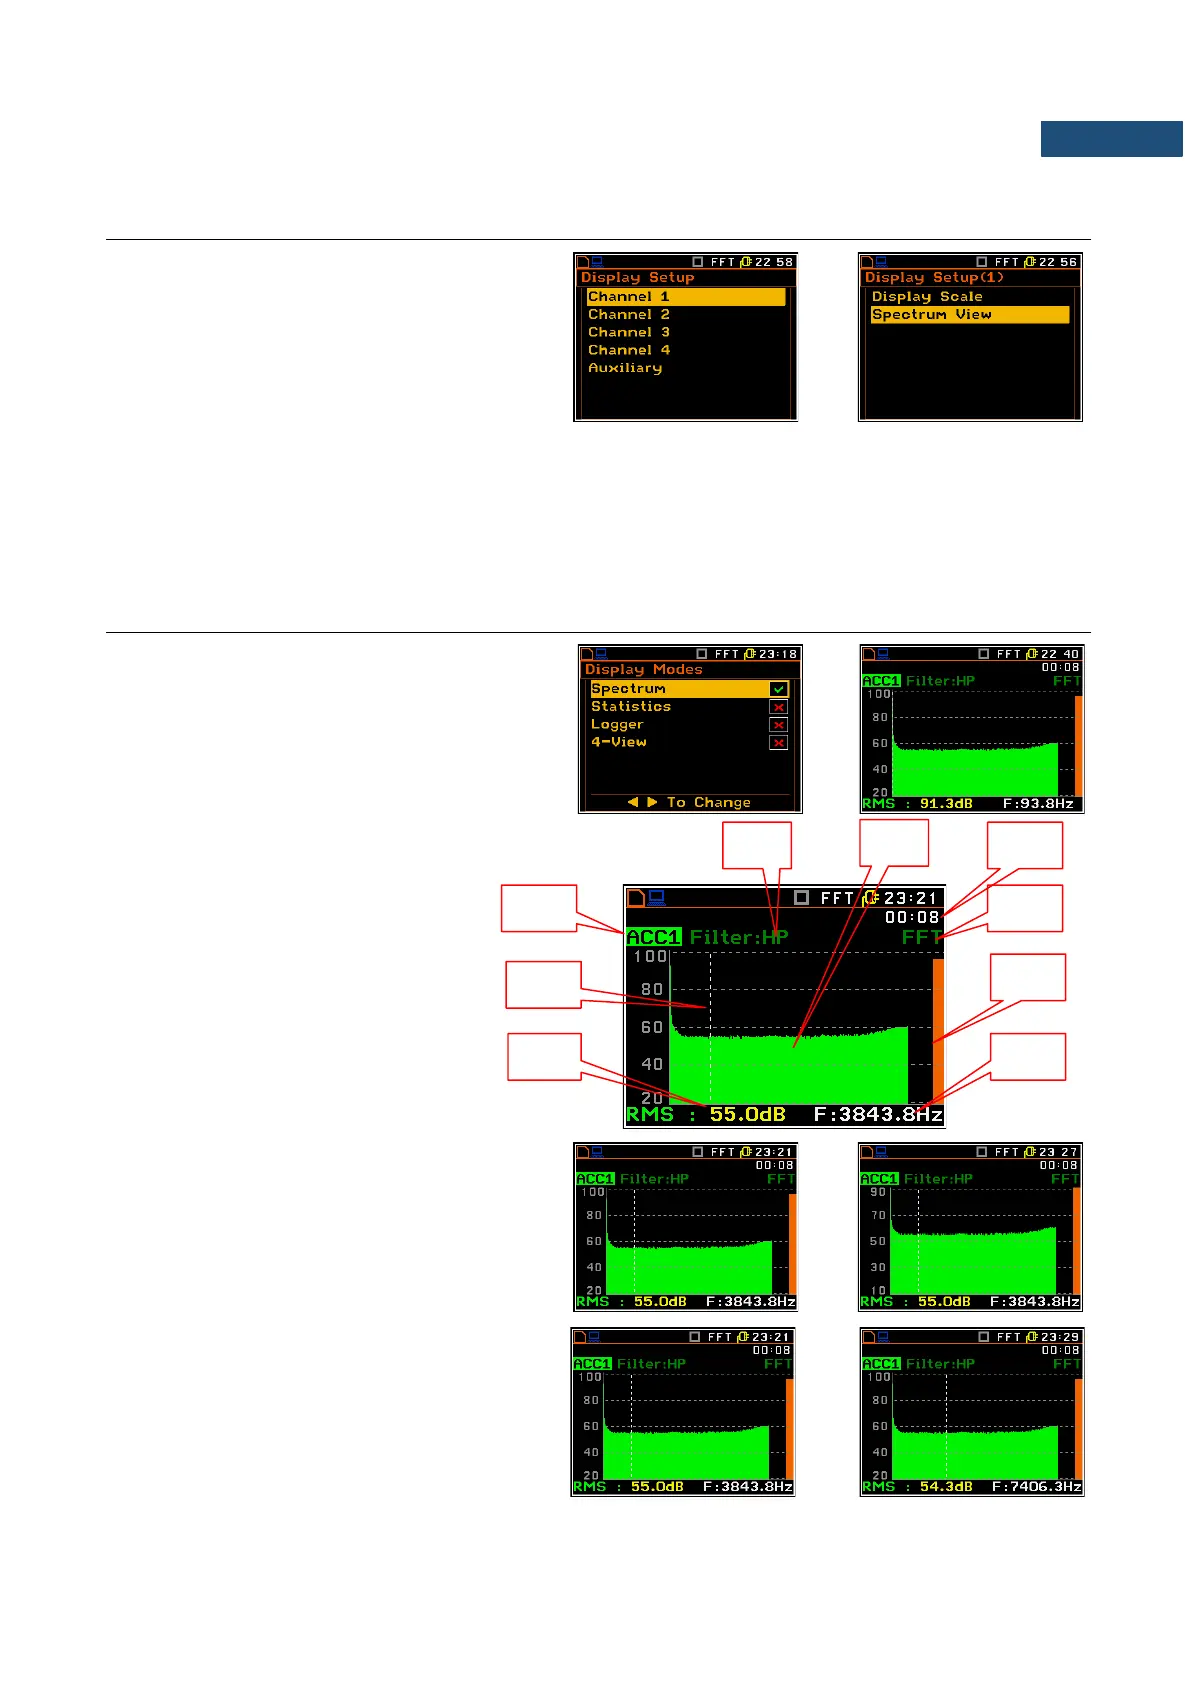
Display Modes enables the user to switch on the spectrum presentation mode;
Display Setup / Channel x enables the user to select options for spectrum presentation:
Display Scale to change the scale of the vertical axis of the graphical presentation;
Spectrum View to choose the type of the spectrum to be presented.
12.4 PRESENTATION OF FFT ANALYSIS RESULTS
The Spectrum position of the Display Modes list
is accessible with FFT function.
When Spectrum mode is switched on the
measurement screen in Spectrum visualisation
mode is as shown here.
Field description of the Spectrum view
1. Channel numer and sygnal type
2. Cursor position
3. Value for the cursor position
4. Used weighting filter
5. Spectrum plot
6. Elapsed time, the current second of the
measurement
7. Type of spectrum
8. Total value
9. Central frequency for the cursor
position
The user may shift the Y-axis during the
spectrum presentation by means of the
<Shift> and ▲ (or the <Shift> and ▼) keys.
The user may change the cursor position by
means of the ◄ / ► key. The frequency and
appropriate value are presented in the line
below the plot.