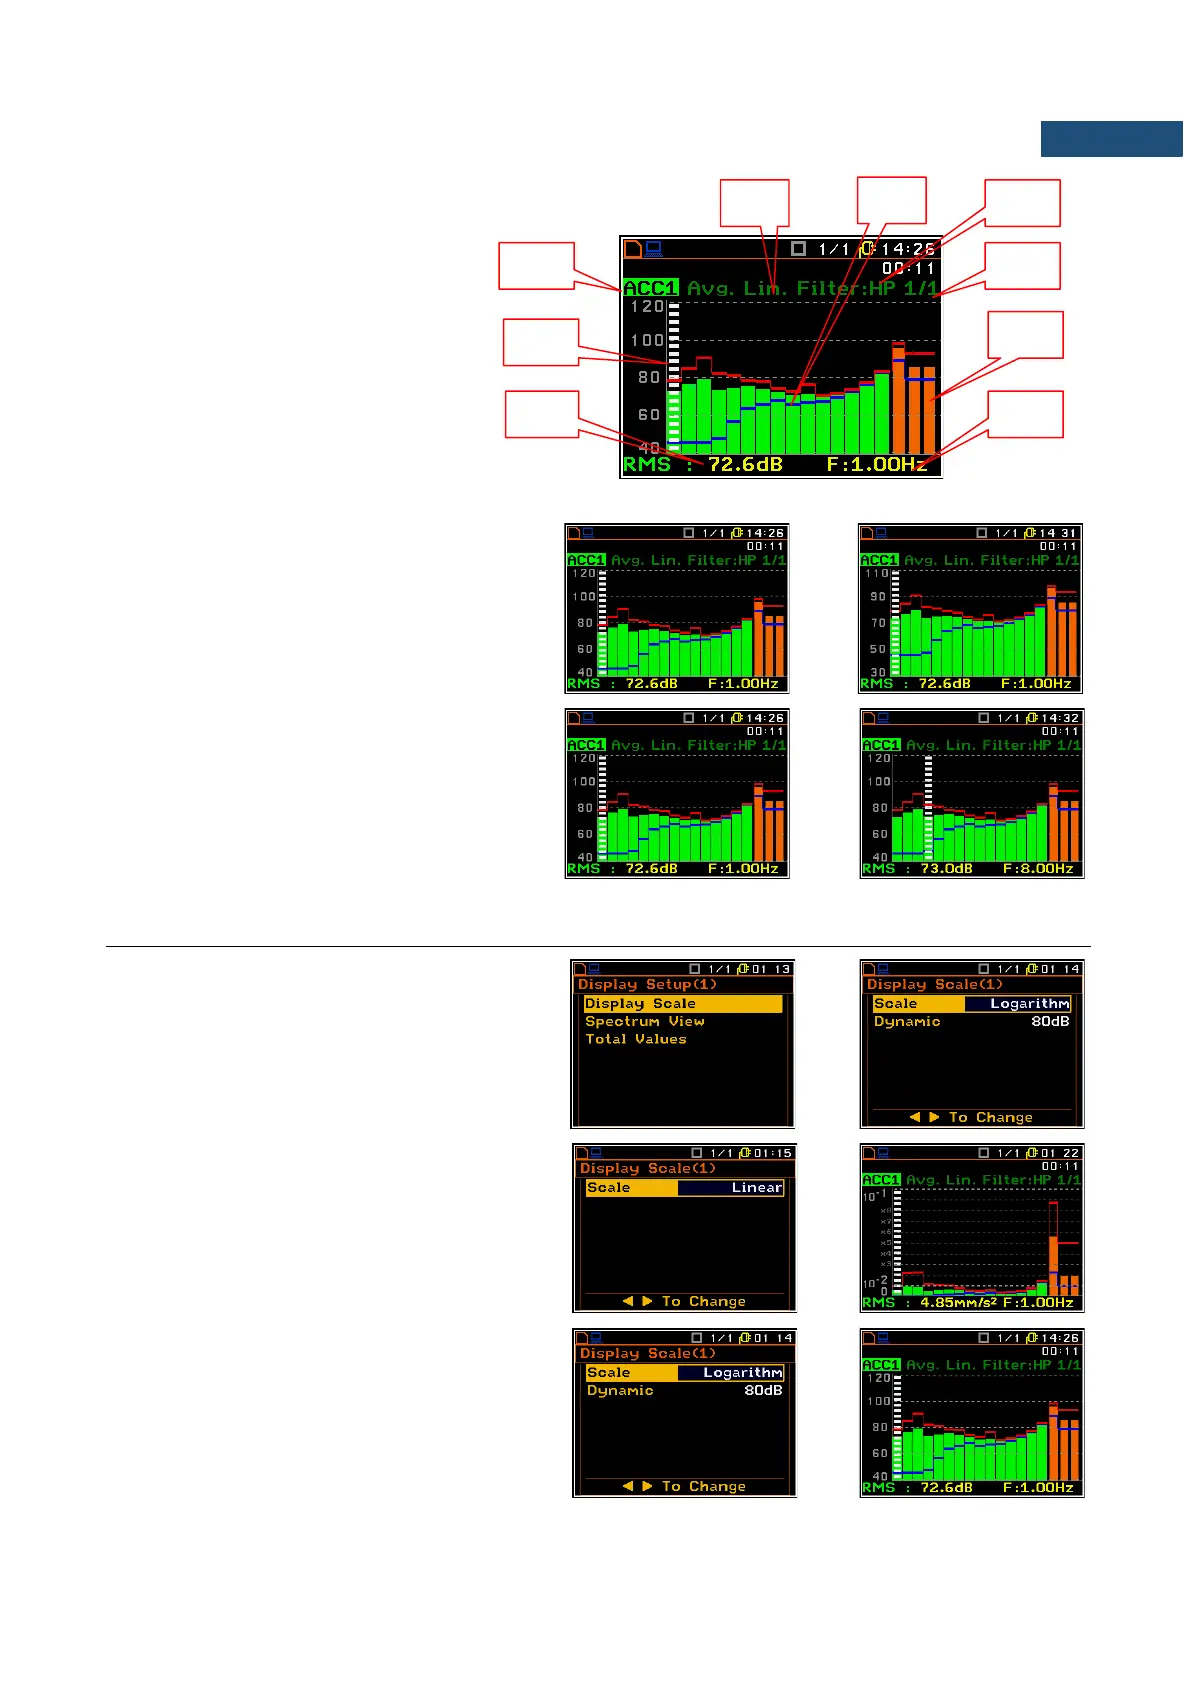
Field description of the Spectrum view
1. Spectrum type/Channel number
2. Cursor position
3. Value for the cursor position
4. Used averaging
5. Spectrum plot
6. Frequency weighting filter
7. Type of spectrum
8. Total values
9. Central frequency for the cursor
position.
The user may shift the Y-axis during the
spectrum presentation by means of the
<Shift> and ▲ (or the <Shift> and ▼) keys.
The user may change the cursor position by
means of the ◄ / ► key. The frequency and
appropriate value are presented in the line
below the plot.
10.6 SETTING THE SCALE OF THE SPECTRUM RESULTS PRESENTATION – DISPLAY SCALE
The Display Scale sub-list enables the user
to change the Y-axis scale in the spectrum
presentation mode for each channel
separately.
Scale of the measurement results
presentation
Two options are available for the Scale
position: Linear and Logarithm.
In case of Linear the Y-scale of spectrum
presentation is linear.
In case of Logarithm the Y-scale of spectrum
presentation is logarithmic and the
measurement results are expressed in
decibels (the results are related to the values
set up in the Reference Level sub-list (path:
<Menu> / Auxiliary Setup / Reference Levels).